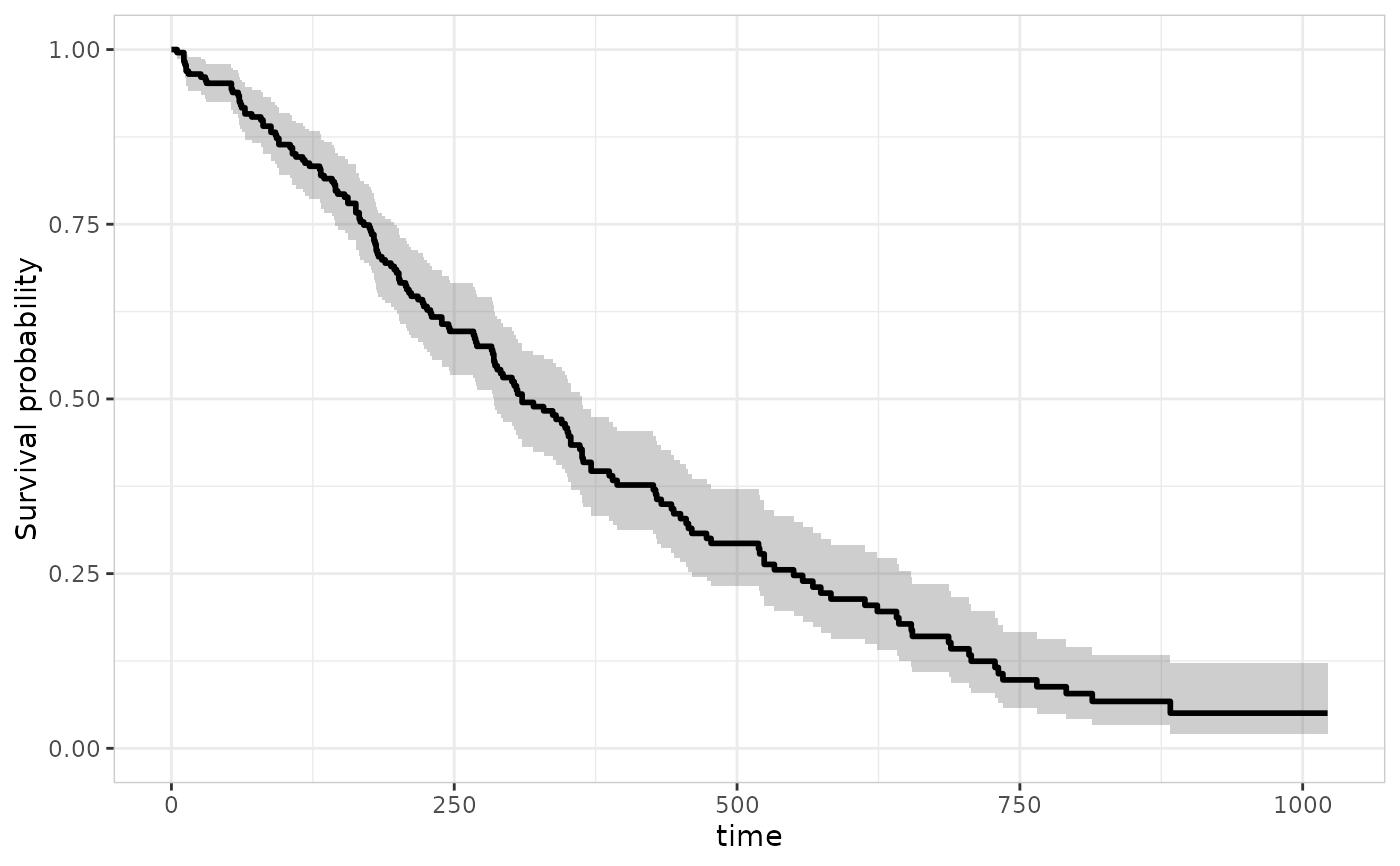
Kaplan-Meier curve builders for the TTE grammar
Source:R/er-tte-style-curve.R
er_style_tte_curve.RdBuilder functions for the curve layer (er_tte_add_curve()),
drawing the Kaplan-Meier estimate as a step function with an optional
step-shaped confidence band.
Usage
er_style_tte_curve_km(
  data,
  config,
  stratify,
  time,
  strata,
  theme,
  show_ci = TRUE,
  ribbon_alpha = 0.15,
  linewidth = 1,
  ...
)
Arguments
- data
The original data frame (
object$data).- config
Configuration for the curve layer (populated by
er_tte_add_curve()):config$table(the tidy KM table, with a(0, 1)origin row prepended per stratum),config$time_upper(the time-axis upper limit, needed so the last confidence-band interval has somewhere to end),config$conf_level.- stratify
Logical: whether the fit is stratified (
!is.null(object$strata)).- time
object$time(name/label/limits).- strata
object$strata(var/label), orNULLwhen unstratified.- theme
object$theme.- show_ci
Whether to draw the confidence band. Default
TRUE.- ribbon_alpha
Transparency of the confidence band (
0-1). Default0.15.- linewidth
Width of the step curve's line. Default
1.- ...
Additional named arguments forwarded from
er_tte_add_curve()'s own....
Details
See er_style_tte() for the shared interface every TTE-grammar
builder implements.
A Kaplan-Meier confidence band is a step function, just like the
curve itself, but ggplot2 has no built-in "step ribbon" geom (unlike
ggplot2::geom_step() for the line). er_style_tte_curve_km() works
around this with ggplot2::geom_rect(): one rectangle per interval
between consecutive event/censoring times, with xmin/xmax the
interval's start/end time and ymin/ymax the interval's constant
lower/upper bound – visually identical to a step ribbon, without
needing a bespoke stat.
Stratified colour/fill both map to config$table's own strata
column (the already-cleaned stratum label, e.g. "Q1" or a
categorical level) rather than the original stratify_by column on
data, since that's what config$table actually carries.
er_tte_build() retitles the resulting legend with strata$label
(e.g. "sex") afterwards, so a builder itself never needs to know
the original variable's name.
er_style_tte_curve_km() is tagged er_style_tag(fn, layer = "curve"), so er_tte_add_curve() errors informatively if handed a
builder tagged for a different layer.
Examples
library(survival)
lung |>
  er_tte(time, status == 2) |>
  er_tte_add_curve(style = er_style_tte_curve_km, ribbon_alpha = 0.3) |>
  plot()