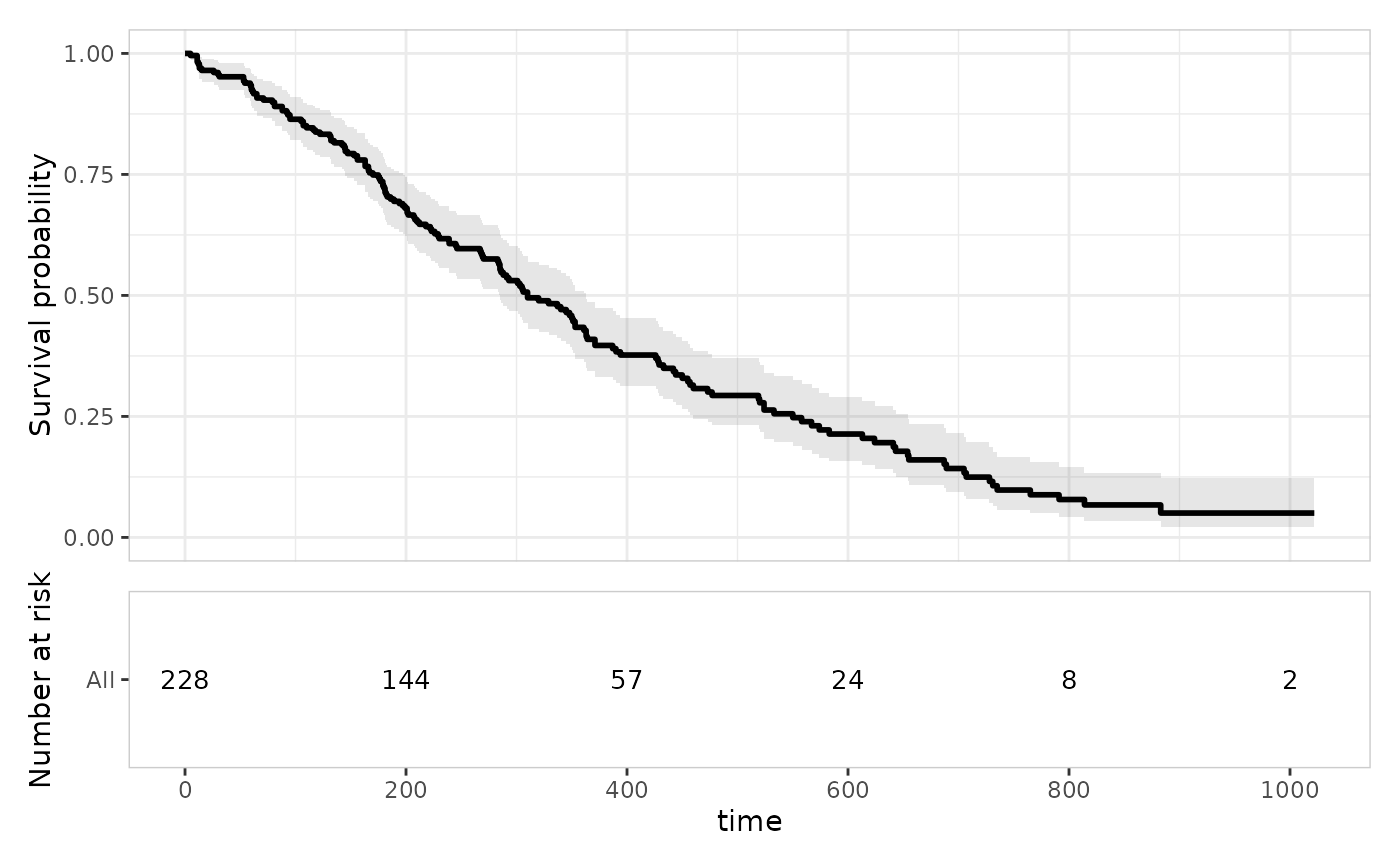
Adds the at-risk table layer to a TTE plot: a separate panel stacked below the curve, showing the number of subjects still at risk at a grid of time points, computed from the fit already stored internally within the plot object.
Arguments
- object
Partially constructed plot (has S3 class
er_tte).- style
Style used to generate the at-risk table in the plot. Can either be a string corresponding to one of the registered style labels (e.g.,
"text", the default), or a builder function used to compute the relevant plot object (see "Styles" below).- times
Numeric vector of time points at which to report the number at risk, or
NULL(the default) to usen_timesevenly spaced breaks across the time range.- n_times
Number of evenly spaced breaks to use when
timesisNULL. Must be a single whole number of at least 2. Ignored whentimesis supplied. Defaults to6.- ...
Additional named arguments forwarded to the
stylebuilder function when the plot is built.
Details
The time breaks used for the number-at-risk grid also become
the x-axis tick marks on the primary plot, so the two panels'
collected x-axis lines up exactly (see er_tte_build()).
Styles
The following pre-defined styles are available for this layer. Please see the documentation for the corresponding builder function to see what customisation options are available:
| Label | Builder | Description |
"text" | er_style_tte_risktable_text() | Number-at-risk counts as a text grid, one row per stratum (the only built-in, and the default). |
See er_style_tte() for details on how style builder functions are
defined for the TTE mini-grammar, should a custom style be required.
Examples
library(survival)
lung |>
  er_tte(time, status == 2) |>
  er_tte_add_curve() |>
  er_tte_add_risktable() |>
  plot()