Number-at-risk builders for the TTE grammar
Source:R/er-tte-style-risktable.R
er_style_tte_risktable.RdBuilder functions for the risktable layer (er_tte_add_risktable()),
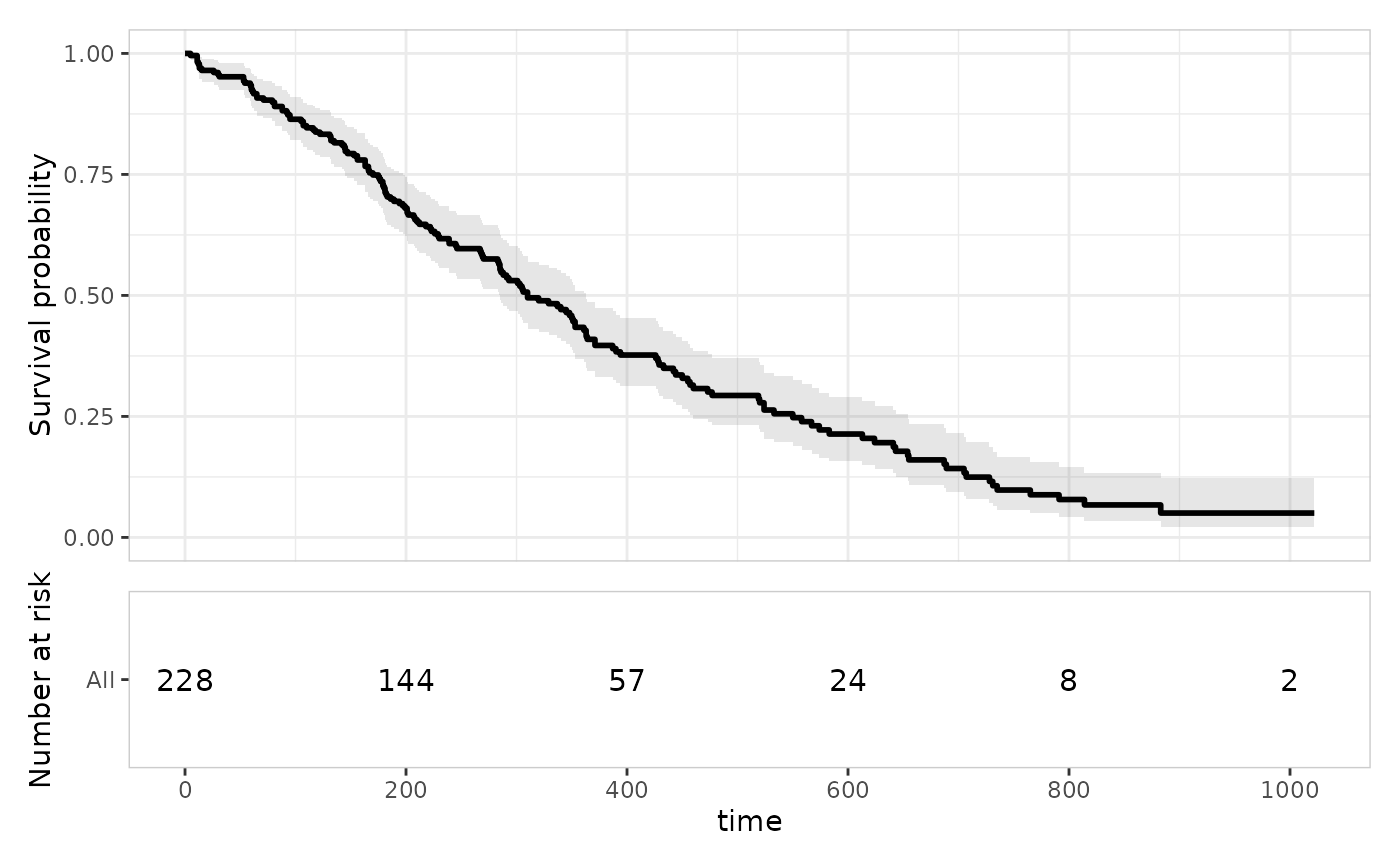
drawing a row of risk counts per stratum at a grid of time points.
Unlike every other TTE-grammar builder, this one's geoms are drawn
into their own patchwork panel below the curve, not onto the curve's
panel directly – see er_tte_build().
Usage
er_style_tte_risktable_text(
  data,
  config,
  stratify,
  time,
  strata,
  theme,
  text_size = 3.5,
  show_percent = FALSE,
  ...
)
Arguments
- data
The original data frame (
object$data).- config
Configuration for the risktable layer (populated by
er_tte_add_risktable()):config$table(time/n_risk/strata/n_baseline– the stratum's time-zero number at risk, used byshow_percentbelow – one row per requested time break per stratum) andconfig$breaks(the time breaks themselves, also used as the curve panel's x-axis ticks).- stratify
Logical: whether the fit is stratified (
!is.null(object$strata)).- time
object$time(name/label/limits).- strata
object$strata(var/label), orNULLwhen unstratified.- theme
object$theme.- text_size
Size of the risk-count text. Default
3.5.- show_percent
Whether to append each break's
n_riskas a percentage of that stratum's own baseline (time-zero) size, formatted viaer_tte_theme()'sformat_percent. DefaultFALSE(a bare count, the previous behaviour).- ...
Additional named arguments forwarded from
er_tte_add_risktable()'s own....
Details
See er_style_tte() for the shared interface every TTE-grammar
builder implements.
Rows are ordered top-to-bottom in the same order strata first appear
in config$table (reversed, since a ggplot2 discrete y-axis plots
its first level at the bottom); an unstratified fit gets a single
"All" row.
show_percent = TRUE displays "<n_risk> (<percent>%)" instead of a
bare n_risk, using er_tte_theme()'s format_percent (defaulting
to scales::label_percent(accuracy = 1)) to format
n_risk / n_baseline – see config above for where n_baseline
comes from.
er_style_tte_risktable_text() is tagged er_style_tag(fn, layer = "risktable"), so er_tte_add_risktable() errors informatively if
handed a builder tagged for a different layer.
Examples
library(survival)
lung |>
  er_tte(time, status == 2) |>
  er_tte_add_curve() |>
  er_tte_add_risktable(style = er_style_tte_risktable_text, text_size = 4) |>
  plot()