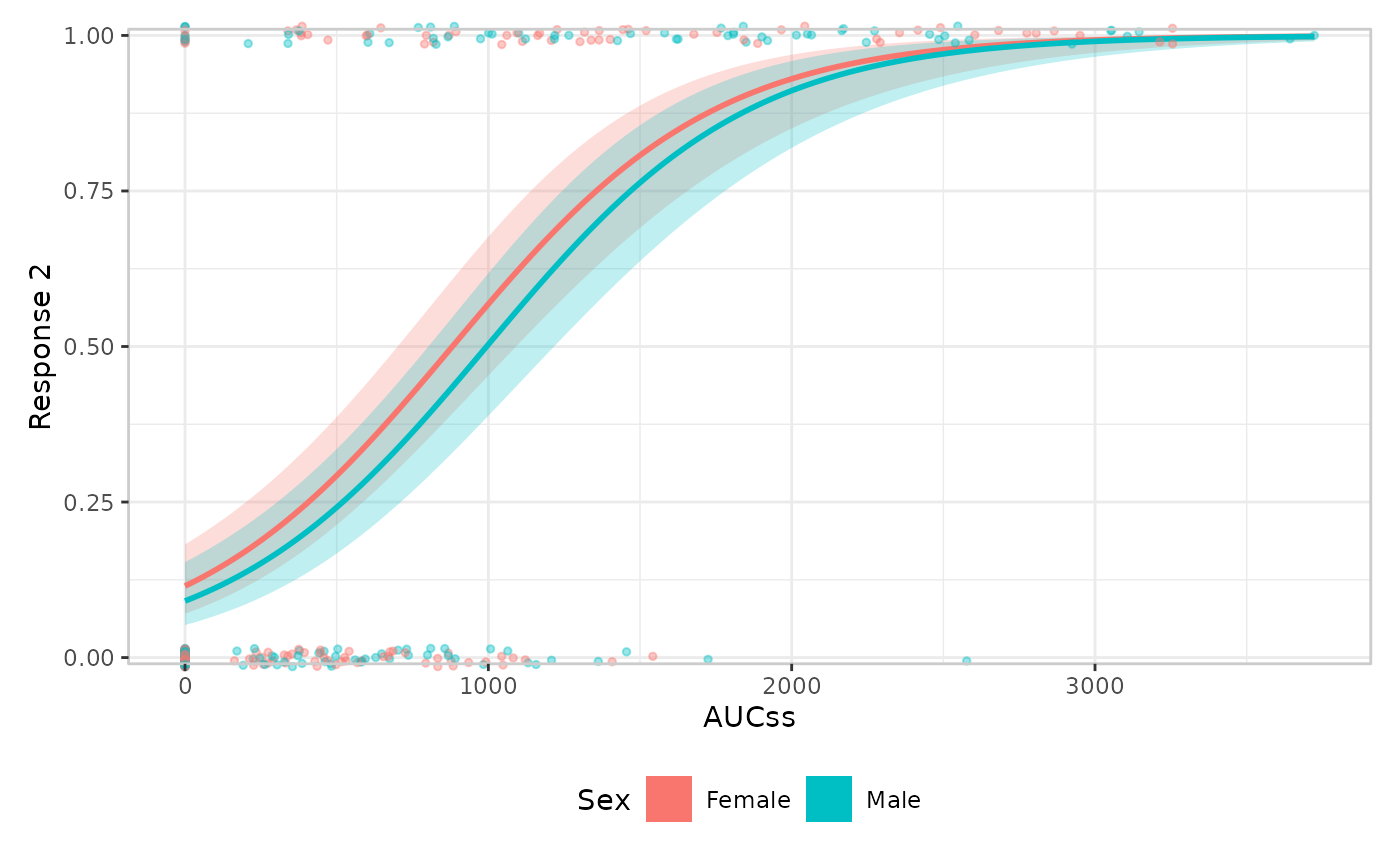
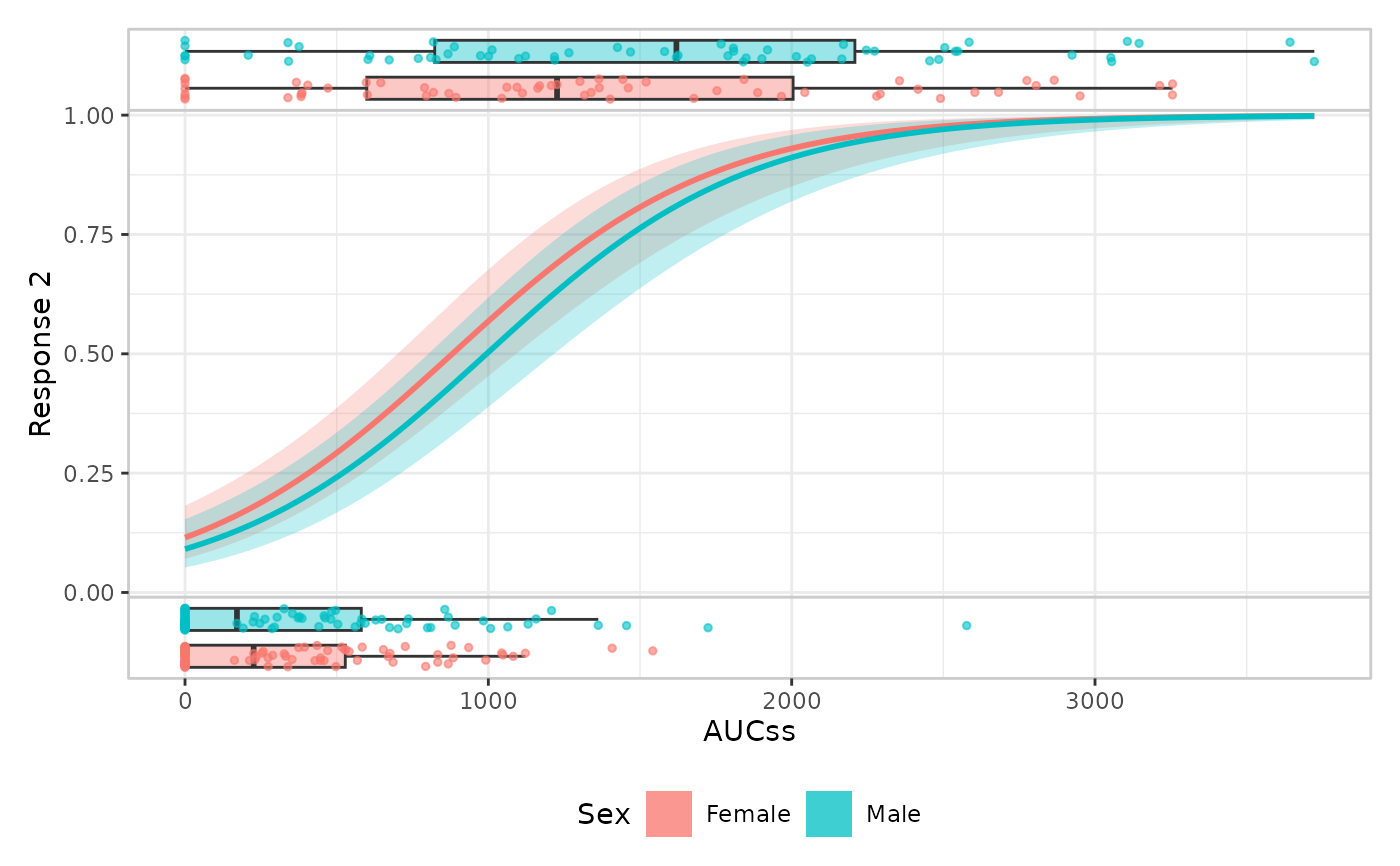
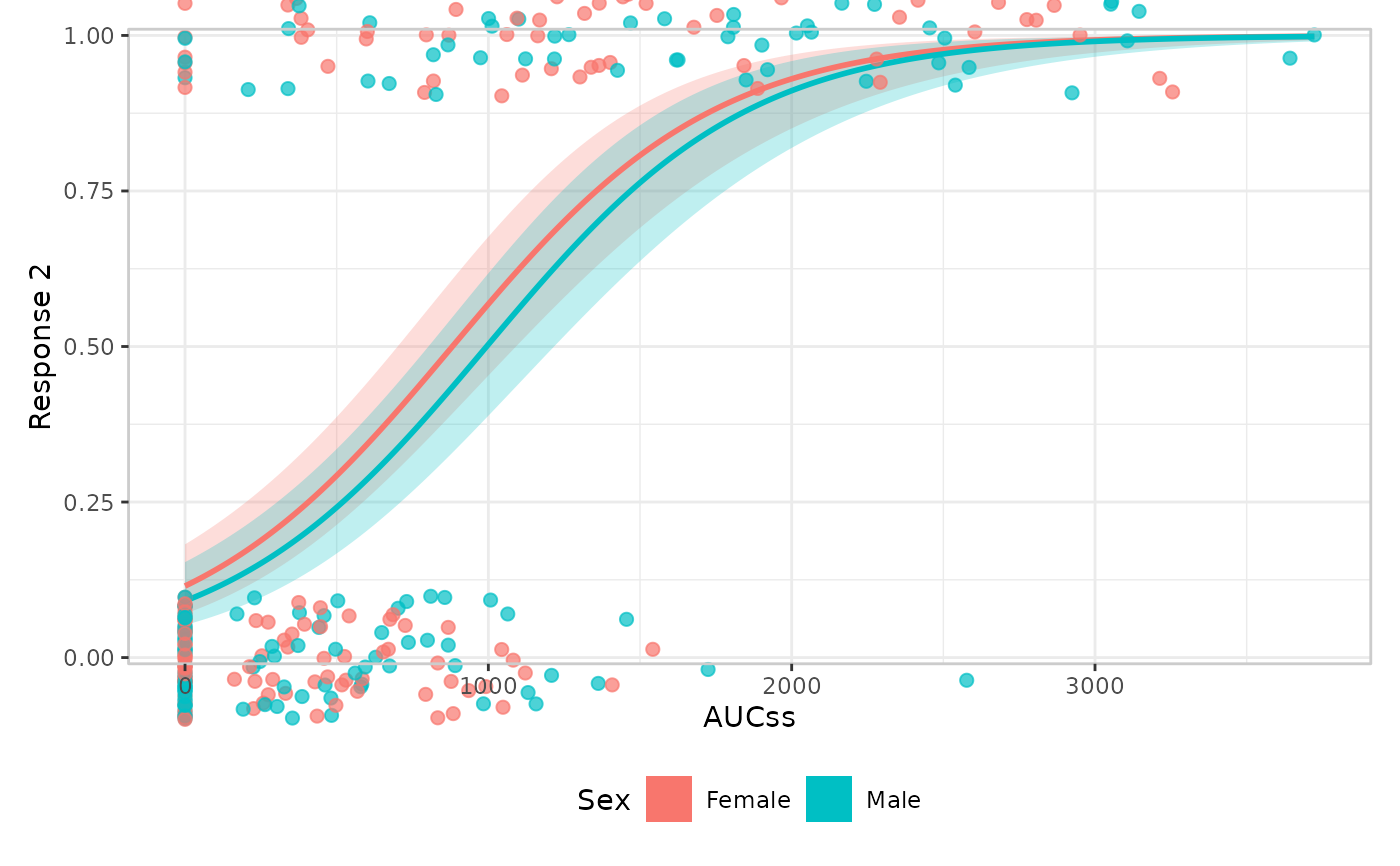
Builder functions for the data layer (er_plot_add_data()), drawing raw
observations either as an overlay on the main panel or as separate
boxplot/jitter panels.
Usage
er_style_data_boxjitter(
  data,
  config,
  stratify,
  exposure,
  response,
  strata,
  theme,
  box_width = 0.6,
  box_alpha = 0.4,
  show_outliers = FALSE,
  jitter_height = NULL,
  jitter_size = 1,
  jitter_alpha = 0.6,
  ...
)

er_style_data_overlay(
  data,
  config,
  stratify,
  exposure,
  response,
  strata,
  theme,
  jitter_height = NULL,
  alpha = 0.4,
  point_size = 1,
  ...
)

er_style_data_hex(
  data,
  config,
  stratify,
  exposure,
  response,
  strata,
  theme,
  bins = 30,
  alpha = 0.85,
  ...
)
Arguments
- data
The original data frame.
- config
Configuration for the specific plot.
- stratify
Logical: whether to stratify.
- exposure
Exposure variable.
- response
Response variable.
- strata
Stratification variable.
- theme
Theme components.
- box_width
Width of
er_style_data_boxjitter()'s boxplot. Defaults to0.6.- box_alpha
Transparency of
er_style_data_boxjitter()'s boxplot fill. Defaults to0.4.- show_outliers
Logical: whether
er_style_data_boxjitter()draws outlier points. Defaults toFALSE, since its raw points are already shown via the jitter layer.- jitter_height
Vertical jitter applied to raw points. Defaults to
NULL:er_style_data_boxjitter()resolves this to0.3when stratified or0.15otherwise;er_style_data_overlay()resolves it to0.015for a binary response (whose y-values would otherwise overplot into two solid lines) or0otherwise.- jitter_size
Point size for
er_style_data_boxjitter()'s jittered points. Defaults to1.- jitter_alpha
Transparency of
er_style_data_boxjitter()'s jittered points. Defaults to0.6.- ...
Additional named arguments forwarded from
er_plot_add_data()'s own....er_style_data_overlay()/er_style_data_boxjitter()read aseedfrom here (viaconfig$seed,NULLwhen not supplied) and pass it toggplot2::position_jitter(), letting a caller make the jitter reproducible across repeatedplot()calls on the same object; with noseed, each render draws a fresh jitter, as for any other jittered geom.- alpha
Point transparency for
er_style_data_overlay()(defaults to0.4); fill transparency forer_style_data_hex()(defaults to0.85).- point_size
Point size for
er_style_data_overlay(). Defaults to1.- bins
Number of hex bins for
er_style_data_hex(). Defaults to30.
Value
A geom, or a list of geoms; see er_style().
Details
See er_style() for the shared builder interface these functions
implement.
Choosing a builder
All three builders draw raw observations, but differ in structural
family (see er_style_tag()'s layout) and which response types
they support:
er_style_data_overlay()(the default) – raw points, overlaid directly on the main panel (layout = "overlay"). Any response type.er_style_data_hex()– a 2D hexbin density overlay on the main panel instead of individual points (layout = "overlay"), useful when there are too many points forer_style_data_overlay()to stay legible. Requires thehexbinpackage.er_style_data_boxjitter()– a boxplot + jitter panel stacked below/above the main panel instead of an overlay (layout = "panel"). Binary-response only.
All built-in data builders are also tagged layer = "plot_data", so
er_plot_add_data() errors if given a builder tagged for another
layer.
Hex fill and draw order
er_style_data_hex() defaults to a light-grey-to-navy ("grey90" to
"#132B43") fill gradient, so a cell's fill fades toward the panel
background as its count approaches zero rather than starting at
ggplot2's own default mid-intensity blue. Override it with
er_plot_theme(fill_continuous = ...).
Because its geoms cover the whole panel, er_style_data_hex() is
tagged er_style_tag(fn, draw_order = "background") (see er_style_tag()),
so it's drawn before the model/summary/quantile layers rather than on
top of them; its default alpha = 0.85 gives those layers a little
extra visibility through even a densely populated hex cell.
Examples
if (requireNamespace("erglm", quietly = TRUE)) {
  library(erglm)
  mod2 <- erglm_model(ae2 ~ aucss + sex, erglm_data, family = binomial())

  # er_style_data_overlay(): the default, raw points on the main panel
  erglm_data |>
    er_plot(aucss, ae2, stratify_by = sex) |>
    er_plot_add_model(mod2) |>
    er_plot_add_data(style = er_style_data_overlay) |>
    plot()

  # er_style_data_boxjitter(): binary-response only, boxplot + jitter
  # panels above/below the main panel instead of an overlay
  erglm_data |>
    er_plot(aucss, ae2, stratify_by = sex) |>
    er_plot_add_model(mod2) |>
    er_plot_add_data(style = er_style_data_boxjitter) |>
    plot()

  # overriding a builder's own visual defaults, e.g. larger/more
  # opaque points and a wider jitter
  erglm_data |>
    er_plot(aucss, ae2, stratify_by = sex) |>
    er_plot_add_model(mod2) |>
    er_plot_add_data(
      style = er_style_data_overlay,
      jitter_height = 0.1,
      alpha = 0.7,
      size = 2
    ) |>
    plot()
}