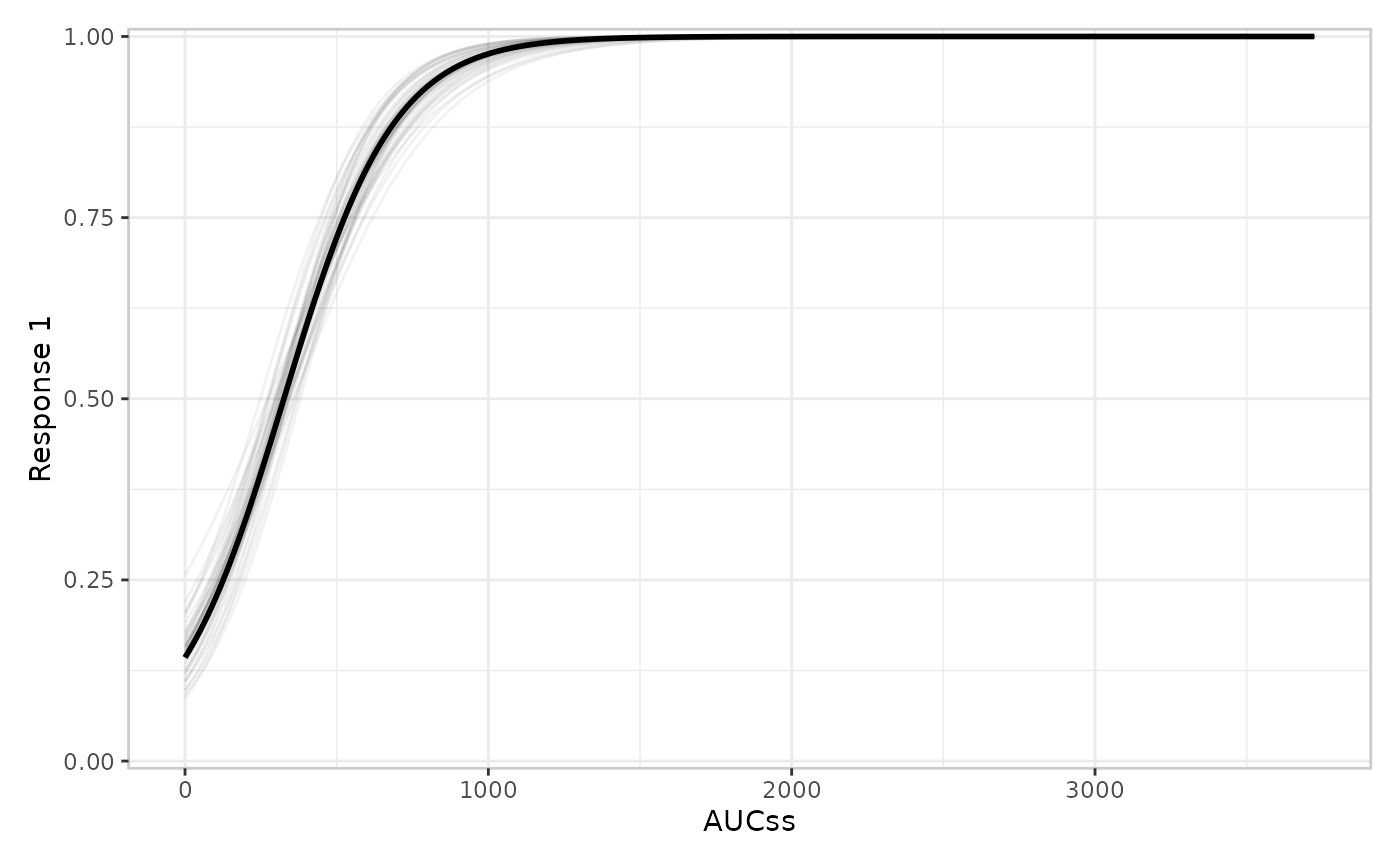
Builder functions for the model layer (er_plot_add_model()), drawing
the fitted exposure-response curve as a ribbon-and-line, a line alone, or a
spaghetti plot of simulated draws.
Usage
er_style_model_ribbonline(
  data,
  config,
  stratify,
  exposure,
  response,
  strata,
  theme,
  ribbon_fill = "grey40",
  ribbon_alpha = 0.25,
  ribbon_edges = FALSE,
  linewidth = 1,
  ...
)

er_style_model_line(
  data,
  config,
  stratify,
  exposure,
  response,
  strata,
  theme,
  linewidth = 1,
  ...
)

er_style_model_spaghetti(
  data,
  config,
  stratify,
  exposure,
  response,
  strata,
  theme,
  alpha = NULL,
  linewidth = 1,
  nsim = 100L,
  ...
)
Arguments
- data
The original data frame
- config
Configuration for the specific plot
- stratify
Logical indicating whether to stratify
- exposure
Exposure variable
- response
Response variable
- strata
Stratification variable
- theme
Theme components
- ribbon_fill
Fill colour for
er_style_model_ribbonline()'s ribbon. Only takes effect when the layer is unstratified – a stratified ribbon already mapsfillto the strata variable, so this argument is ignored in that case. Default"grey40".- ribbon_alpha
Transparency of
er_style_model_ribbonline()'s ribbon (0-1), stratified or not. Default0.25.- ribbon_edges
Whether
er_style_model_ribbonline()additionally draws a dashedggplot2::geom_path()along the ribbon's ownci_lower/ci_upperbounds, on top of the shaded ribbon fill. DefaultFALSE(ribbon fill only).- linewidth
Width of the fitted curve's line, for all three model builders (
er_style_model_ribbonline()/_line()'s single curve,er_style_model_spaghetti()'s mean curve drawn on top of the spaghetti draws). Default1.- ...
Additional named arguments forwarded from
er_plot_add_model()'s own...; seeer_style()'s "Passing extra arguments to a builder" section.er_style_model_spaghetti()reads aseedfrom here (falling back toconfig$seed– currently alwaysNULLfor the model layer – when none is supplied) to pass toer_simulate(), letting a caller override erglm's auto-selected seed.- alpha
Transparency of
er_style_model_spaghetti()'s individual simulated draws (0-1). Defaults toNULL, which uses0.1unstratified and0.25stratified. An explicit value overrides this for both cases uniformly.- nsim
Number of simulated draws for
er_style_model_spaghetti(), passed toer_simulate(). Default100L.
Value
A geom, or a list of geoms; see er_style().
Details
See er_style() for the shared builder interface these functions
implement, including how to write a custom builder of your own.
Choosing a builder
All three builders draw the same fitted exposure-response curve; which one to reach for is a choice of how to convey uncertainty around it:
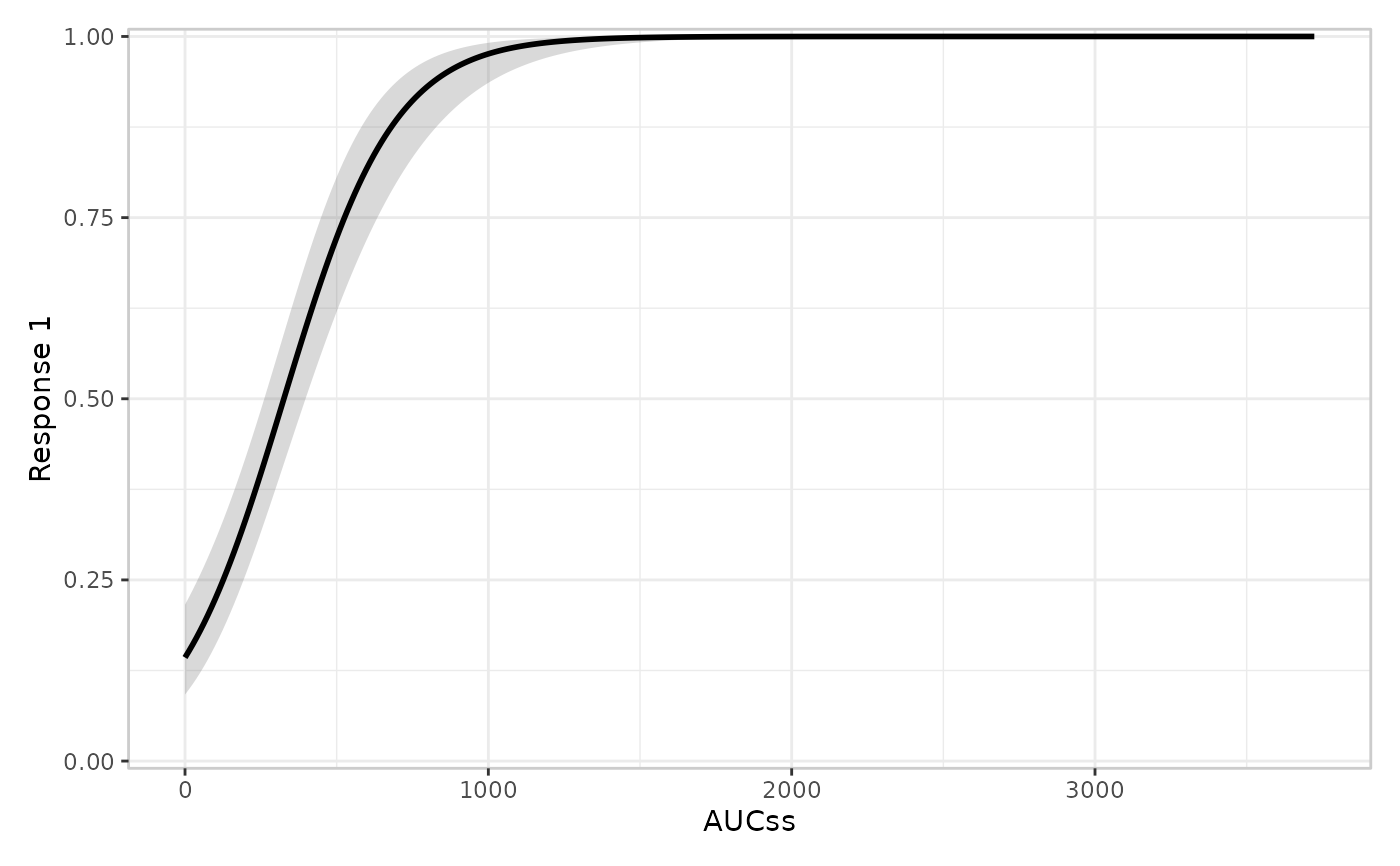
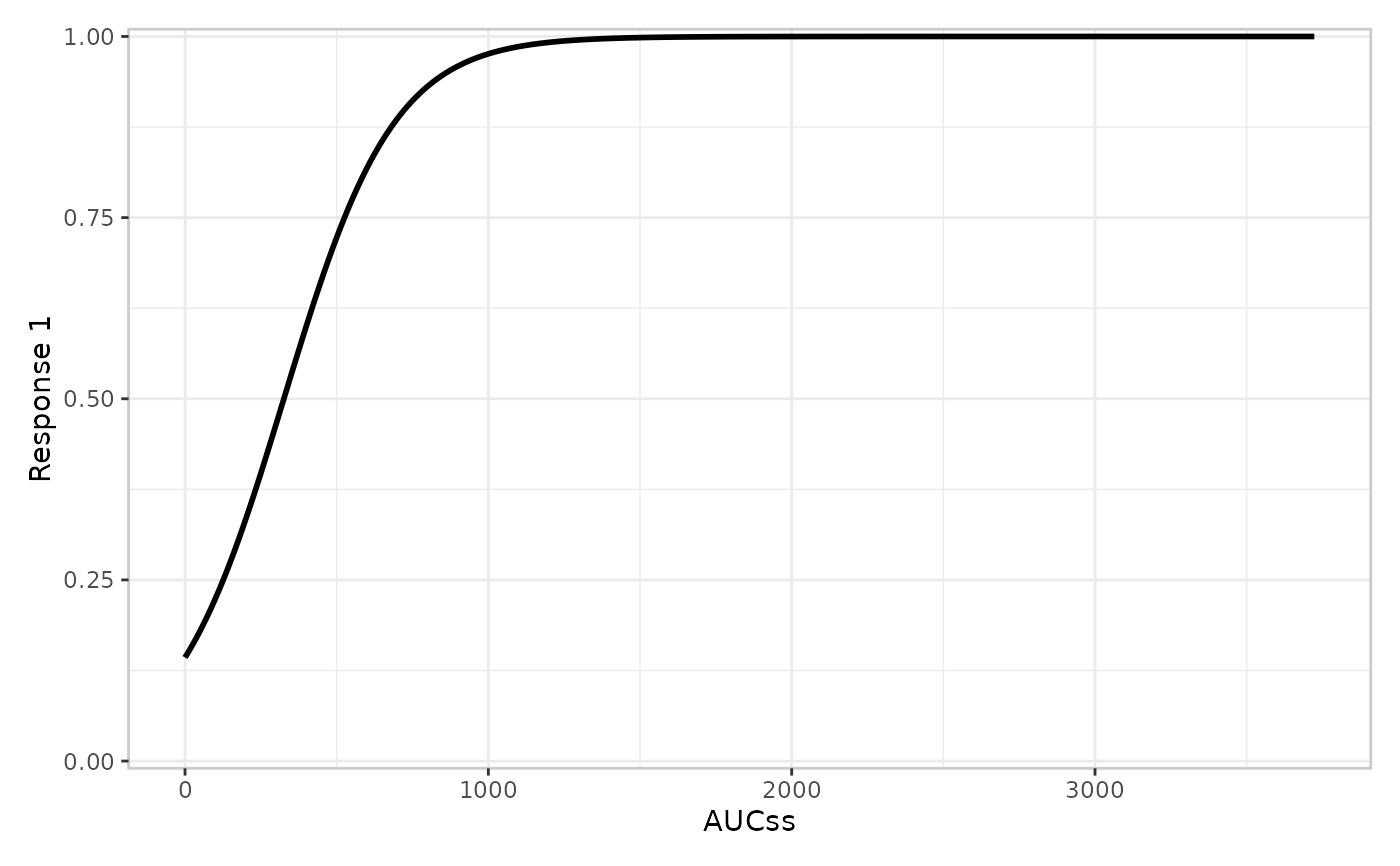
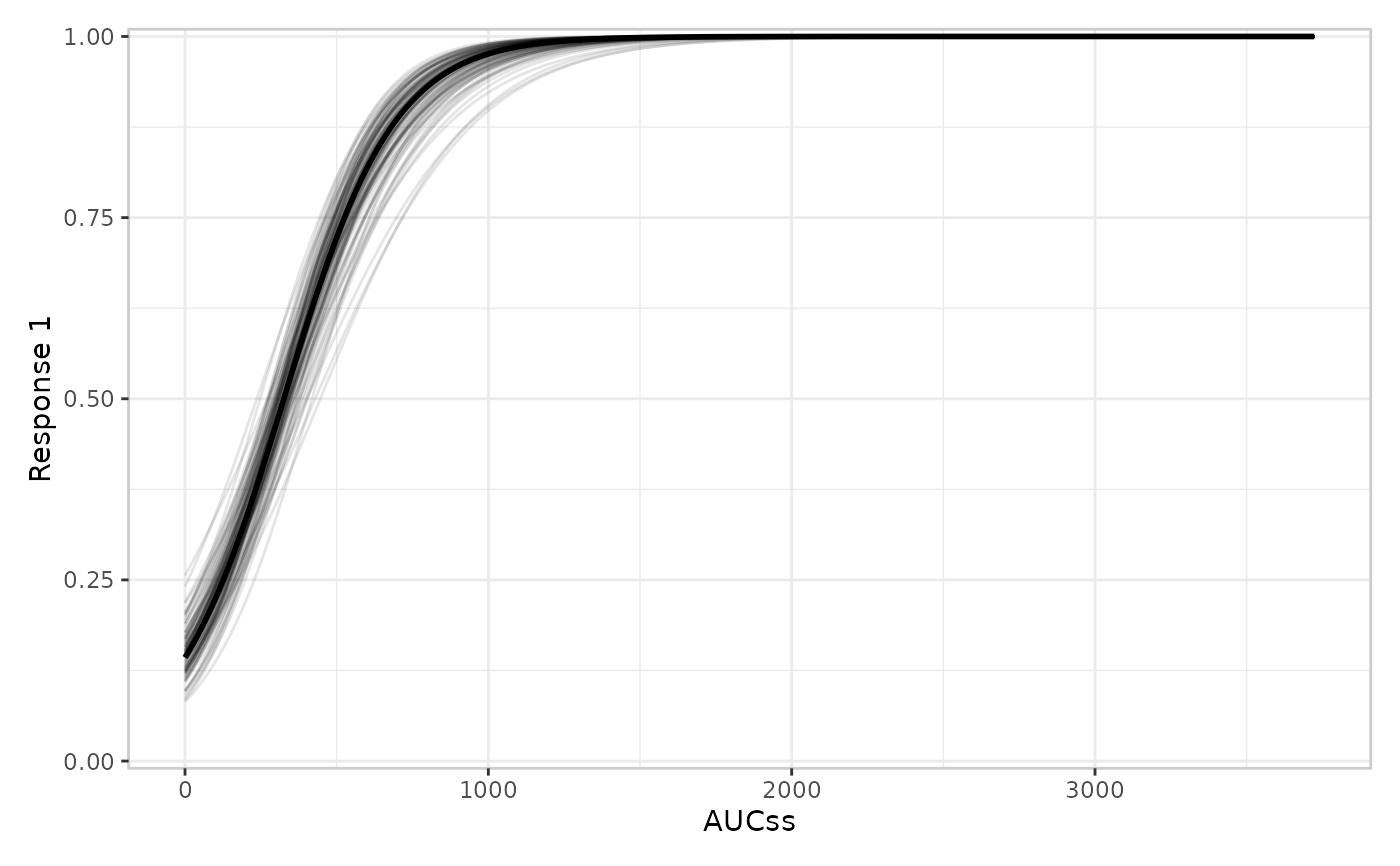
er_style_model_ribbonline()(the default) – the curve plus a shaded confidence ribbon.er_style_model_line()– the curve alone, omitting the ribbon.er_style_model_spaghetti()– the curve overlaid on individual simulated draws instead of a ribbon, for models that implementer_simulate().
All three are tagged er_style_tag(fn, layer = "plot_model"), so
er_plot_add_model() errors informatively if handed one of these
tagged for a different layer entirely (e.g. "summary", meant for
er_plot_add_summary()). Each also carries a registered short-string
label – "ribbonline"/"line"/"spaghetti" respectively – so
er_plot_add_model()'s style argument can take that string instead
of the function itself (see er_style_labels()).
Examples
if (requireNamespace("erglm", quietly = TRUE)) {
  library(erglm)
  mod <- erglm_model(ae1 ~ aucss, erglm_data, family = binomial())

  # er_style_model_ribbonline(): ribbon + line, the default
  erglm_data |>
    er_plot(aucss, ae1) |>
    er_plot_add_model(mod, style = er_style_model_ribbonline) |>
    plot()

  # er_style_model_line(): line only, no ribbon
  erglm_data |>
    er_plot(aucss, ae1) |>
    er_plot_add_model(mod, style = er_style_model_line) |>
    plot()

  # er_style_model_spaghetti(): simulated draws instead of a ribbon;
  # `seed` is forwarded to `er_simulate()` via `...`
  erglm_data |>
    er_plot(aucss, ae1) |>
    er_plot_add_model(mod, style = er_style_model_spaghetti, seed = 4821) |>
    plot()

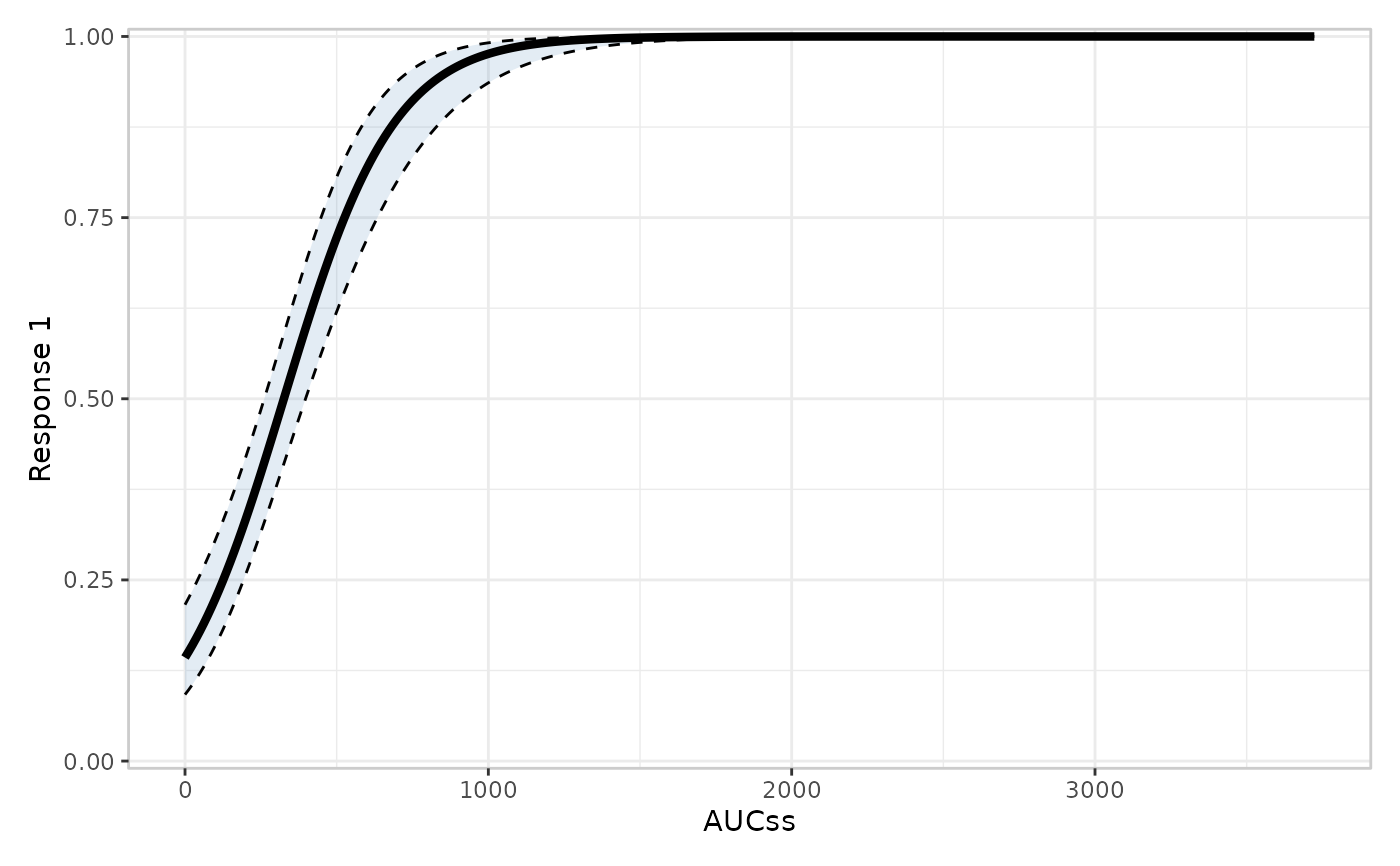
  # overriding a builder's own visual defaults: a thicker, less
  # saturated ribbon with its bounds outlined, and fewer/fainter
  # spaghetti draws
  erglm_data |>
    er_plot(aucss, ae1) |>
    er_plot_add_model(
      mod,
      style = er_style_model_ribbonline,
      ribbon_fill = "steelblue",
      ribbon_alpha = 0.15,
      ribbon_edges = TRUE,
      linewidth = 1.5
    ) |>
    plot()

  erglm_data |>
    er_plot(aucss, ae1) |>
    er_plot_add_model(
      mod,
      style = er_style_model_spaghetti,
      seed = 4821,
      nsim = 40L,
      alpha = 0.05
    ) |>
    plot()
}