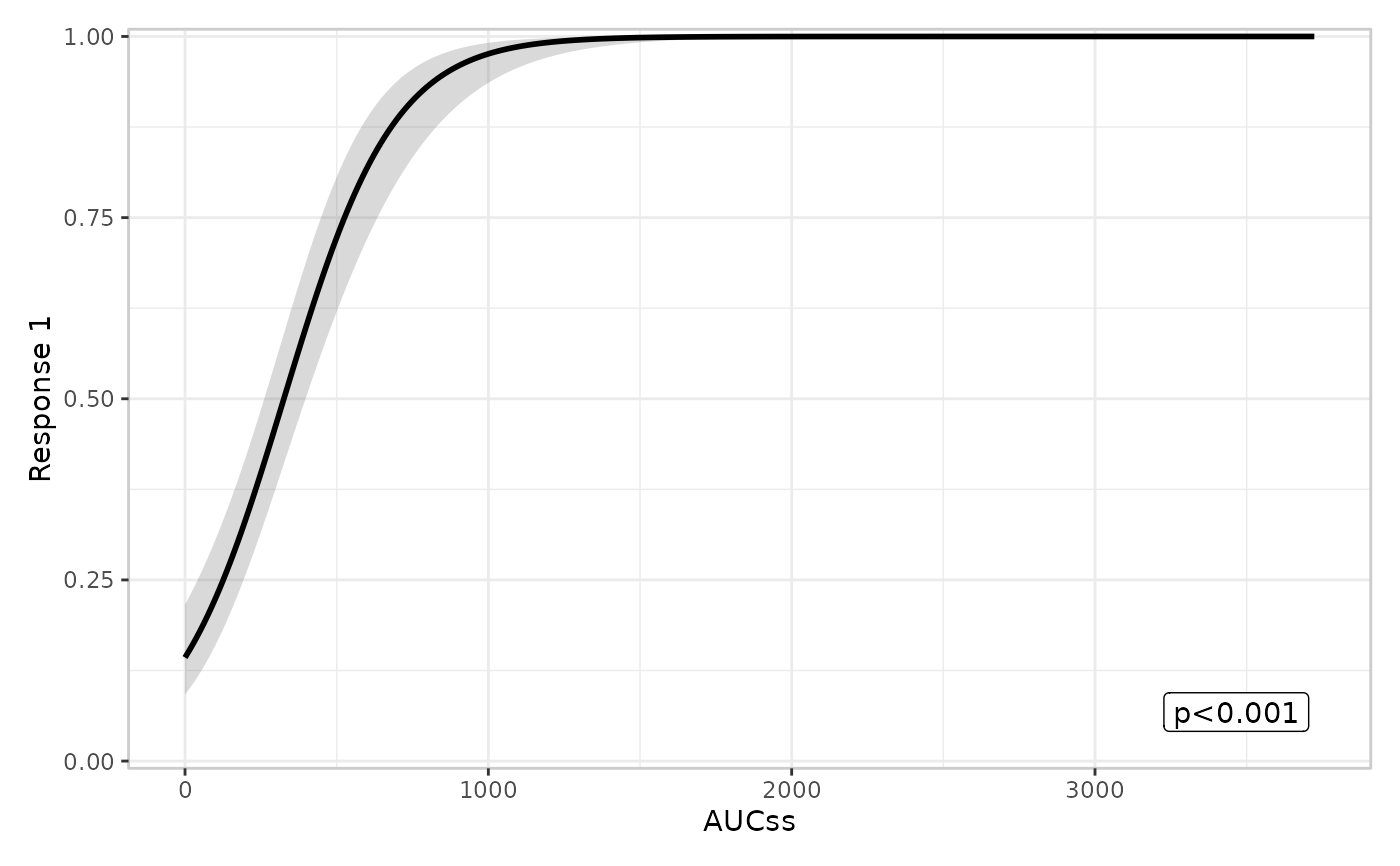
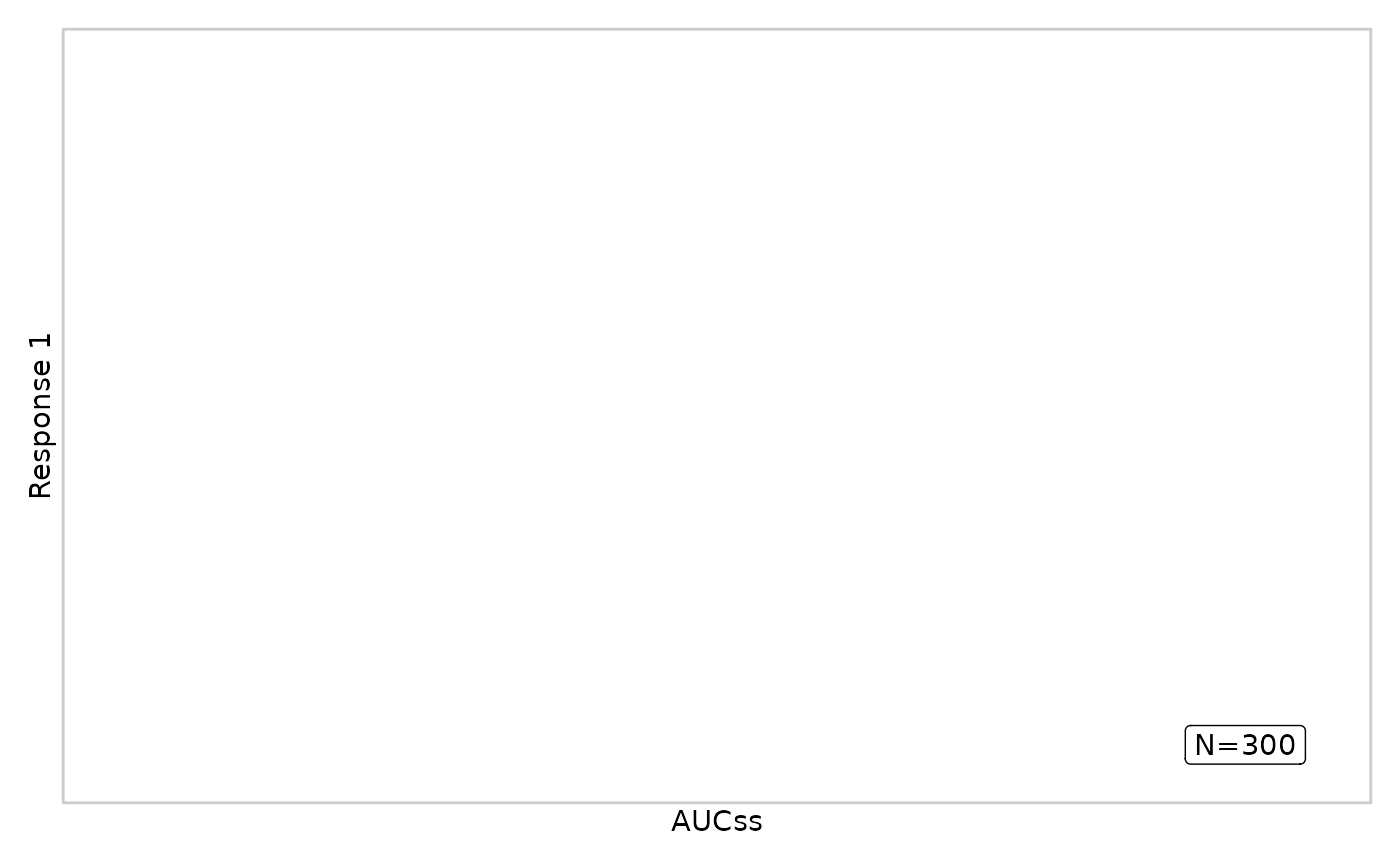
Adds the summary layer: a text/label annotation placed in whichever
corner of the base panel is furthest from the observed data, computed
from the raw (exposure, response) coordinates of the data.
Usage
er_plot_add_summary(
  object,
  model = NULL,
  style = NULL,
  keep_strata = NULL,
  conf_level = 0.95,
  summary_args = list(),
  ...
)
Arguments
- object
Partially constructed plot (has S3 class
er_plot).- model
A fitted exposure-response model, or
NULL(the default). Only needed for builder styles (e.g.er_style_summary_pvalue()) that produce model-based summaries; a purely descriptive builder (e.g.er_style_summary_n()) ignores it.- style
Style used to draw the summary annotation layer. Can either be a string corresponding to one of the registered style labels (e.g.,
"pvalue", the default), or a builder function used to compute the relevant plot object (see "Styles" below).- keep_strata
Logical; whether this layer should use stratification. Defaults to
TRUEwhen a stratification variable has been specified, andFALSEotherwise.- conf_level
Confidence level forwarded to
er_summary()(used, e.g., for theconf_low/conf_highcolumns of itscoefficientsresult – see?er_model_interface). Defaults to0.95. Ignored whenmodelisNULL.- summary_args
A named list of additional arguments forwarded to
er_summary()when generating summaries.- ...
Additional named arguments forwarded to the
stylebuilder function when the plot is built.
Styles
The following pre-defined styles are available for this layer. Please see the documentation for the corresponding builder function to see what customisation options are available:
| Label | Builder | Description |
"pvalue" | er_style_summary_pvalue() | A formatted p-value from the model's er_summary() result (the default). |
"n" | er_style_summary_n() | Observation counts; model-agnostic, works with model = NULL. |
"coefficients" | er_style_summary_coefficients() | One line per model parameter, from er_summary()'s coefficients table. |
"gof" | er_style_summary_gof() | A goodness-of-fit annotation (N/AIC/BIC/R-squared) from er_summary()'s glance table. |
See er_style() for details on how style builder functions are
defined for the exposure-response mini-grammar, should a custom style
be required.
Examples
if (requireNamespace("erglm", quietly = TRUE)) {
library(erglm)
mod <- erglm_model(ae1 ~ aucss, erglm_data, family = binomial())
erglm_data |>
  er_plot(aucss, ae1) |>
  er_plot_add_model(mod) |>
  er_plot_add_summary(model = mod) |>
  plot()

# a purely descriptive annotation, with no model at all
erglm_data |>
  er_plot(aucss, ae1) |>
  er_plot_add_summary(style = er_style_summary_n) |>
  plot()
}