Summary annotation builders for exposure-response plots
Source:R/er-plot-style-summary.R
er_style_summary.RdBuilder functions for the summary layer (er_plot_add_summary()),
drawing a text/label annotation from a model's p-value, coefficients,
goodness-of-fit statistics, or observation counts.
Usage
er_style_summary_pvalue(
  data,
  config,
  stratify,
  exposure,
  response,
  strata,
  theme,
  inset = 0.05,
  label_size = NULL,
  label_colour = NULL,
  label_fill = NULL,
  ...
)

er_style_summary_n(
  data,
  config,
  stratify,
  exposure,
  response,
  strata,
  theme,
  inset = 0.05,
  label_size = NULL,
  label_colour = NULL,
  label_fill = NULL,
  ...
)

er_style_summary_coefficients(
  data,
  config,
  stratify,
  exposure,
  response,
  strata,
  theme,
  inset = 0.05,
  label_size = NULL,
  label_colour = NULL,
  label_fill = NULL,
  ...
)

er_style_summary_gof(
  data,
  config,
  stratify,
  exposure,
  response,
  strata,
  theme,
  inset = 0.05,
  fields = c("n", "aic", "bic", "r_squared"),
  label_size = NULL,
  label_colour = NULL,
  label_fill = NULL,
  ...
)
Arguments
- data
The original data frame.
- config
Configuration for the specific plot.
- stratify
Logical: whether to stratify.
- exposure
Exposure variable.
- response
Response variable.
- strata
Stratification variable.
- theme
Theme components.
- inset
Distance from the panel edge for the annotation label. Defaults to
0.05.- label_size
Label text size. Defaults to
NULL(ggplot2::geom_label()'s own default).- label_colour
Label text colour. Defaults to
NULL(ggplot2::geom_label()'s own default).- label_fill
Label background fill. Defaults to
NULL(ggplot2::geom_label()'s own default).- ...
Additional named arguments forwarded from
er_plot_add_model()'s own....- fields
Fields from
glanceto include forer_style_summary_gof(), and the order they're shown in: one or more of"n","aic","bic", or"r_squared". Defaults to all four, in that order. A field is shown only when both present and non-NAin the model'sglanceresult.
Value
A geom, or a list of geoms; see er_style().
Details
See er_style() for the shared builder interface these functions
implement, including how to write a custom builder of your own.
Choosing a builder
Each builder draws a different kind of annotation, with its own data requirements:
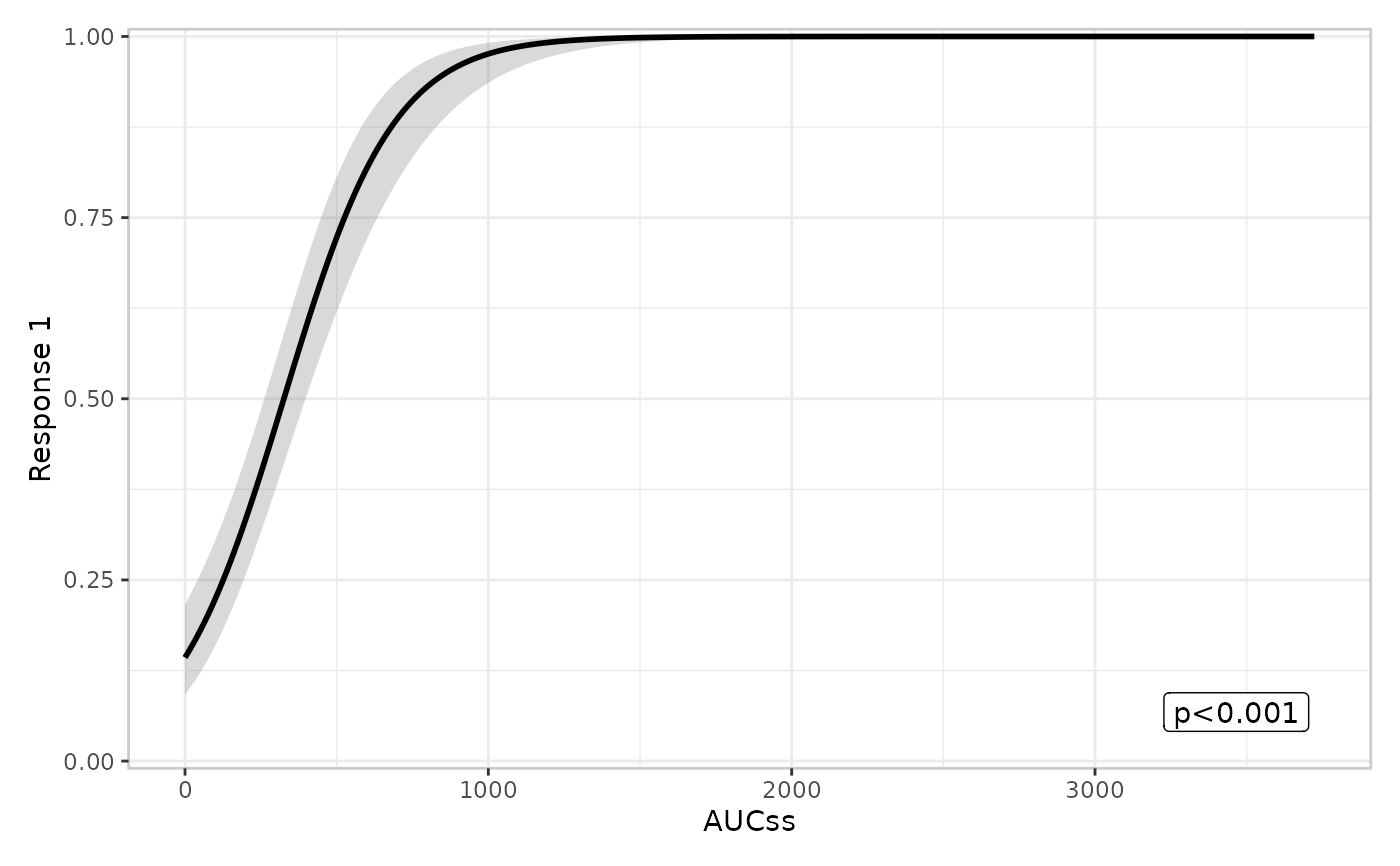
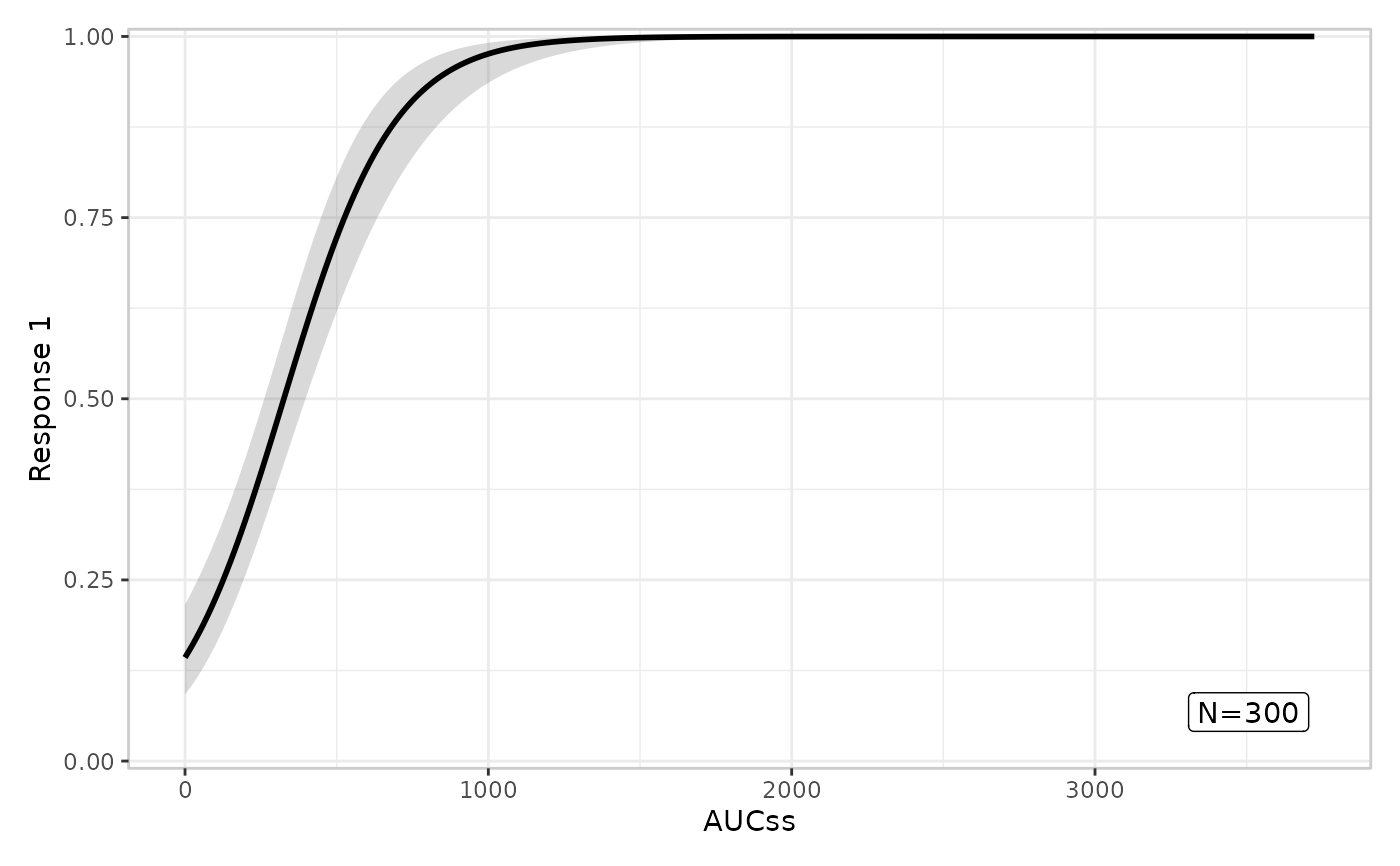
er_style_summary_pvalue()(the default) – a formatted p-value from the model'ser_summary()result.er_style_summary_n()– observation counts. Doesn't have to originate from a fitted model at all.er_style_summary_coefficients()– one line per row of the model'scoefficientstable (seeer_summary()'scoefficientsfield), useful for models with several parameters and no single privileged p-value (e.g. a multi-parameter nonlinear model). Draws nothing ifcoefficientswasn't supplied, or if the layer is stratified.er_style_summary_gof()– a single-line, comma-separated goodness-of-fit annotation from the model'sglancefield (seeer_summary()) – a curated subset (N, AIC, BIC, R-squared) rather than every reservedglancecolumn, showing only whichever of those four are actually present and non-NA. Same restrictions aser_style_summary_coefficients(): draws nothing if none of those fields are available, or if the layer is stratified.
Tags
All four builders are tagged er_style_tag(fn, layer = "plot_summary"),
so er_plot_add_summary() errors informatively if a builder tagged
for a different layer is passed to it instead.
Examples
if (requireNamespace("erglm", quietly = TRUE)) {
  library(erglm)
  mod <- erglm_model(ae1 ~ aucss, erglm_data, family = binomial())

  # er_style_summary_pvalue(): the default, drawn from the model's own
  # er_summary()
  erglm_data |>
    er_plot(aucss, ae1) |>
    er_plot_add_model(mod) |>
    er_plot_add_summary(model = mod, style = er_style_summary_pvalue) |>
    plot()

  # er_style_summary_n(): model-agnostic observation count
  erglm_data |>
    er_plot(aucss, ae1) |>
    er_plot_add_model(mod) |>
    er_plot_add_summary(style = er_style_summary_n) |>
    plot()
}