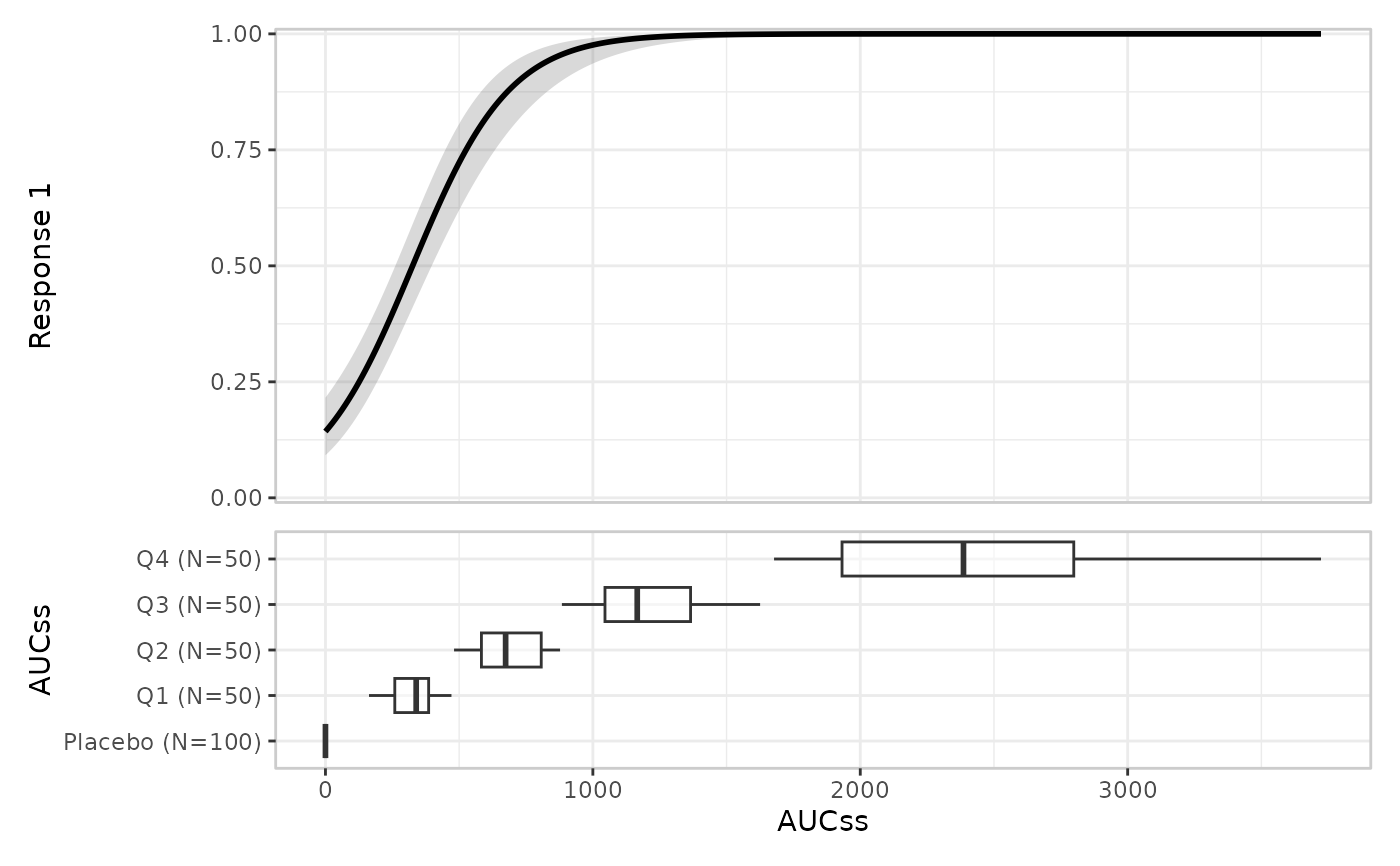
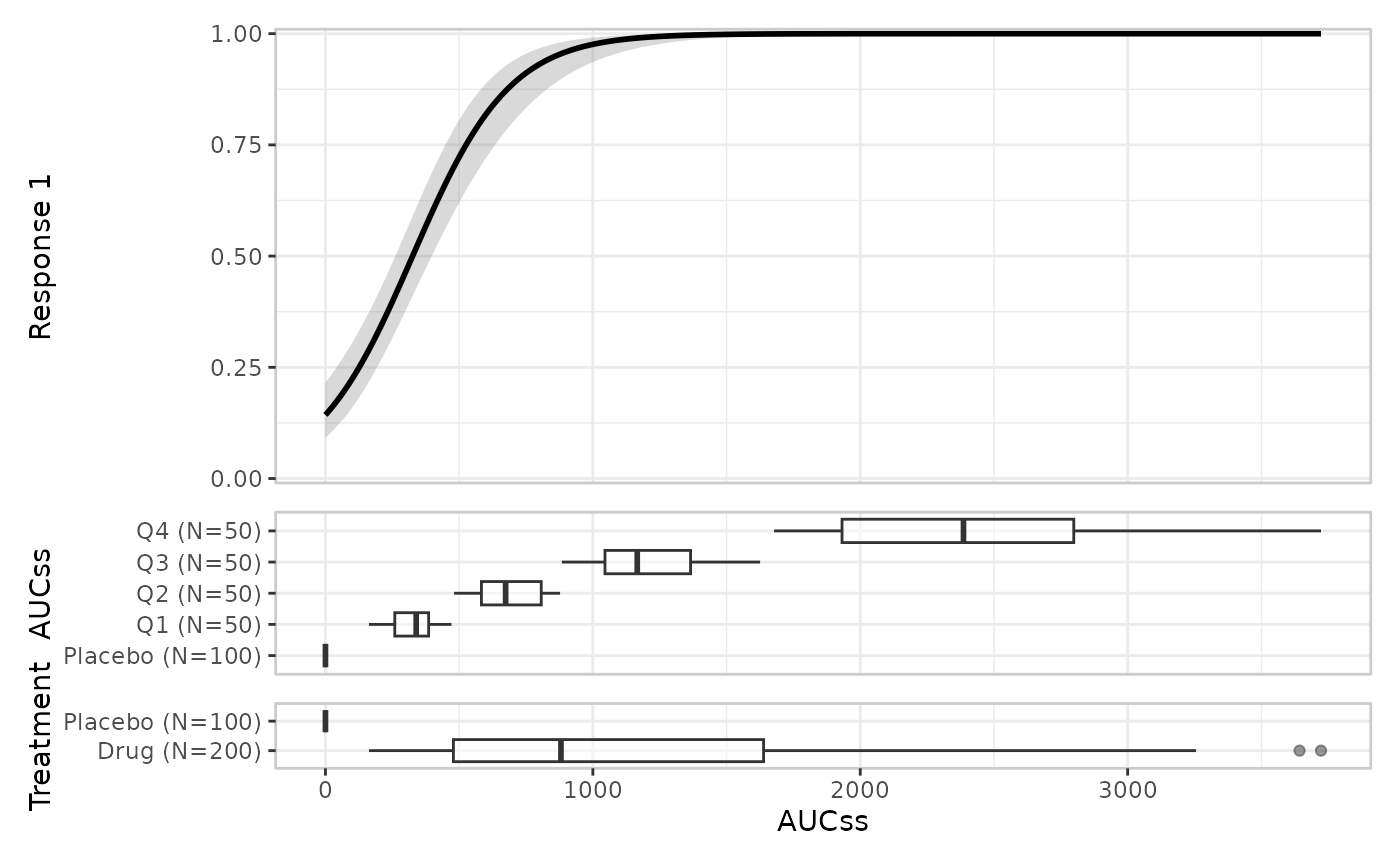
Adds a group layer: a boxplot/violin panel showing the exposure distribution, split by one or more grouping variables (continuous grouping variables are binned into quantiles first).
Usage
er_plot_add_groups(
  object,
  group_by,
  style = NULL,
  keep_strata = NULL,
  n_bins = NULL,
  ties = "upward",
  quantile_type = 7,
  labeller = NULL,
  ...
)
Arguments
- object
Partially constructed plot (has S3 class
er_plot).- group_by
Grouping variables to define groups for distribution plots (a tidyselection of variables).
- style
Style used to draw the group layer. Can either be a string corresponding to one of the registered style labels (e.g.,
"boxplot", the default), or a builder function used to compute the relevant plot object (see "Styles" below).- keep_strata
Logical; whether this layer should use stratification. Defaults to
TRUEwhen a stratification variable has been specified, andFALSEotherwise.- n_bins
Number of quantile bins used for continuous grouping variables (
NULL, the default, usescut_quantile()'s own default). Applied identically to every grouping variable added by this call.- ties, quantile_type, labeller
Passed straight through to
cut_quantile()/cut_exposure_quantile()to control how a continuous grouping variable is split into bins – see their documentation for what each controls. Applied identically to every grouping variable added by this call.- ...
Additional named arguments forwarded to the
stylebuilder function when the plot is built.
Details
Unlike the other four layers, the groups layer is additive: each call adds another panel alongside any already added by a previous call, rather than replacing it.
er_style_group_violin() and er_style_group_histogram() are the
other built-in style options; any function matching the standard
(data, config, stratify, exposure, response, strata, theme, ...)
signature can be supplied instead. If style is tagged with a
layer (via er_style_tag()) other than "plot_group", this errors
informatively; an untagged builder is never checked.
keep_strata = TRUE errors if group_by is itself the plot's
stratification variable, since that would mean grouping and
stratifying by the same column at once; pass keep_strata = FALSE
for that grouping variable instead.
n_bins/ties/quantile_type/labeller are local to this call –
different grouping variables (including across separate
er_plot_add_groups() calls) aren't required to agree, and generally
shouldn't: they're usually different variables with no reason to share
a binning scheme. The one exception is grouping by the plot's own
exposure variable, which risks silently disagreeing with
er_plot_add_quantiles()'s own exposure-binning; er_plot_build()
warns (doesn't error) if the two disagree in that specific case.
Styles
The following pre-defined styles are available for this layer. Please see the documentation for the corresponding builder function to see what customisation options are available:
| Label | Builder | Description |
"boxplot" | er_style_group_boxplot() | Boxplot per group level, group levels on the y-axis (the default). |
"violin" | er_style_group_violin() | Violin per group level, group levels on the y-axis. |
"histogram" | er_style_group_histogram() | Histogram per group level, group levels on facet strips, y-axis freed for counts. |
"linerange" | er_style_group_linerange() | Median dot with inner/outer-range lines per group level, group levels on the y-axis. |
"boxjitter" | er_style_group_boxjitter() | "boxplot" with jittered raw exposure values overlaid. |
"violinjitter" | er_style_group_violinjitter() | "violin" with jittered raw exposure values overlaid. |
See er_style() for details on how style builder functions are
defined for the exposure-response mini-grammar, should a custom style
be required.
Examples
if (requireNamespace("erglm", quietly = TRUE)) {
library(erglm)
mod <- erglm_model(ae1 ~ aucss, erglm_data, family = binomial())
erglm_data |>
  er_plot(aucss, ae1) |>
  er_plot_add_model(mod) |>
  er_plot_add_groups(aucss) |>
  plot()

# additive: a second call adds a second panel rather than replacing the first
erglm_data |>
  er_plot(aucss, ae1) |>
  er_plot_add_model(mod) |>
  er_plot_add_groups(aucss) |>
  er_plot_add_groups(treatment) |>
  plot()
}