Builder functions for the group layer (er_plot_add_groups()), drawing
the exposure distribution for a grouping variable as a boxplot, violin, or
histogram panel.
Usage
er_style_group_boxplot(
  data,
  config,
  stratify,
  exposure,
  response,
  strata,
  theme,
  alpha = 0.5,
  show_outliers = TRUE,
  ...
)

er_style_group_histogram(
  data,
  config,
  stratify,
  exposure,
  response,
  strata,
  theme,
  bins = 30,
  alpha = NULL,
  ...
)

er_style_group_violin(
  data,
  config,
  stratify,
  exposure,
  response,
  strata,
  theme,
  alpha = 0.5,
  quantiles = NULL,
  quantile_linetype = "solid",
  ...
)

er_style_group_linerange(
  data,
  config,
  stratify,
  exposure,
  response,
  strata,
  theme,
  scale_factor = 1,
  inner_range = c(0.25, 0.75),
  outer_range = c(0.05, 0.95),
  dot_alpha = 1,
  inner_alpha = 0.8,
  outer_alpha = 0.4,
  ...
)

er_style_group_boxjitter(
  data,
  config,
  stratify,
  exposure,
  response,
  strata,
  theme,
  alpha = 0.5,
  jitter_height = 0.15,
  jitter_size = 1,
  jitter_alpha = 0.6,
  ...
)

er_style_group_violinjitter(
  data,
  config,
  stratify,
  exposure,
  response,
  strata,
  theme,
  alpha = 0.5,
  quantiles = NULL,
  quantile_linetype = "solid",
  jitter_height = 0.15,
  jitter_size = 1,
  jitter_alpha = 0.6,
  ...
)
Arguments
- data
The original data frame.
- config
Configuration for the specific plot.
- stratify
Logical: whether to stratify.
- exposure
Exposure variable.
- response
Response variable.
- strata
Stratification variable.
- theme
Theme components.
- alpha
Transparency of the geom. Defaults to
0.5forer_style_group_boxplot()/er_style_group_violin()/er_style_group_boxjitter()/er_style_group_violinjitter();er_style_group_histogram()defaults toNULL, which resolves to0.5when stratified or0.8otherwise.- show_outliers
Logical: whether
er_style_group_boxplot()draws the boxplot's own outlier points. Defaults toTRUE;er_style_group_boxjitter()sets this toFALSEwhen it wraps this builder, since its own jittered points already show every raw value, outliers included.- ...
Additional named arguments forwarded from
er_plot_add_groups()'s own....er_style_group_boxjitter()/er_style_group_violinjitter()read aseedfrom here (NULLwhen not supplied) and use it to scope (viawithr::with_seed()) the vertical jitter draw, letting a caller make the jitter reproducible across repeatedplot()calls on the same object – the same opt-in-only mechanismer_style_data_overlay()/er_style_data_boxjitter()use for the data layer (seeer_style_data()); with noseed, each render draws a fresh jitter.- bins
Number of histogram bins for
er_style_group_histogram(). Defaults to30.- quantiles, quantile_linetype
Violin quantile positions and linetype for
er_style_group_violin(). Default toNULL(no quantile lines drawn) and"solid"respectively.- scale_factor
Overall size multiplier for
er_style_group_linerange()'s dot and lines. Defaults to1.- inner_range, outer_range
Quantile probabilities (length 2) for
er_style_group_linerange()'s thick and thin lines. Default toc(0.25, 0.75)andc(0.05, 0.95)respectively.- dot_alpha, inner_alpha, outer_alpha
Per-part transparency for
er_style_group_linerange()'s dot, inner line, and outer line. Default to1,0.8, and0.4respectively.- jitter_height, jitter_size, jitter_alpha
Vertical jitter, point size, and transparency for
er_style_group_boxjitter()/er_style_group_violinjitter()'s overlaid points. Default to0.15,1, and0.6respectively.
Value
A geom, or a list of geoms; see er_style().
Details
See er_style() for the shared builder interface these functions
implement.
Choosing a builder
All six builders show the same thing – a grouping variable's exposure distribution – as one of a few visual idioms:
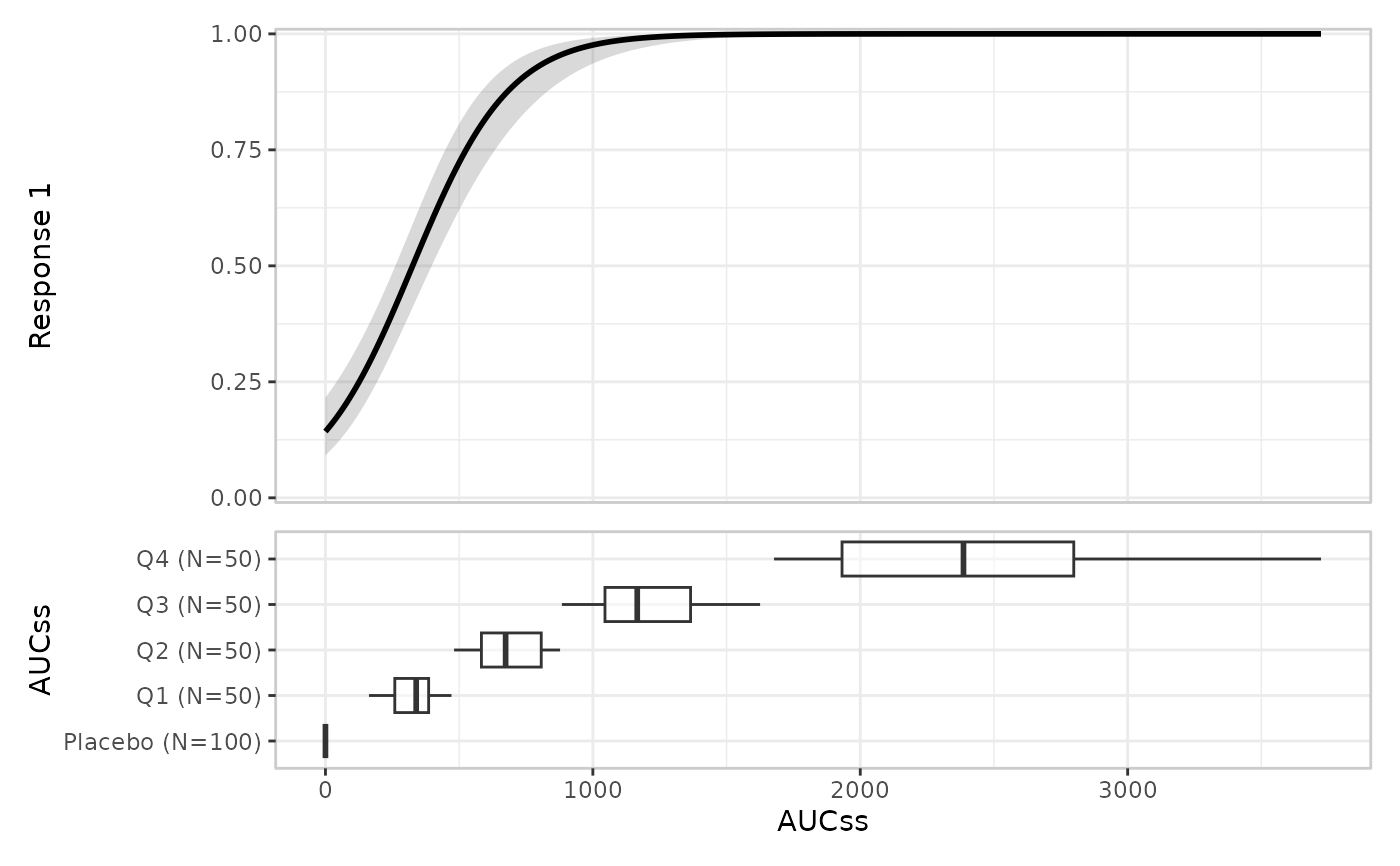
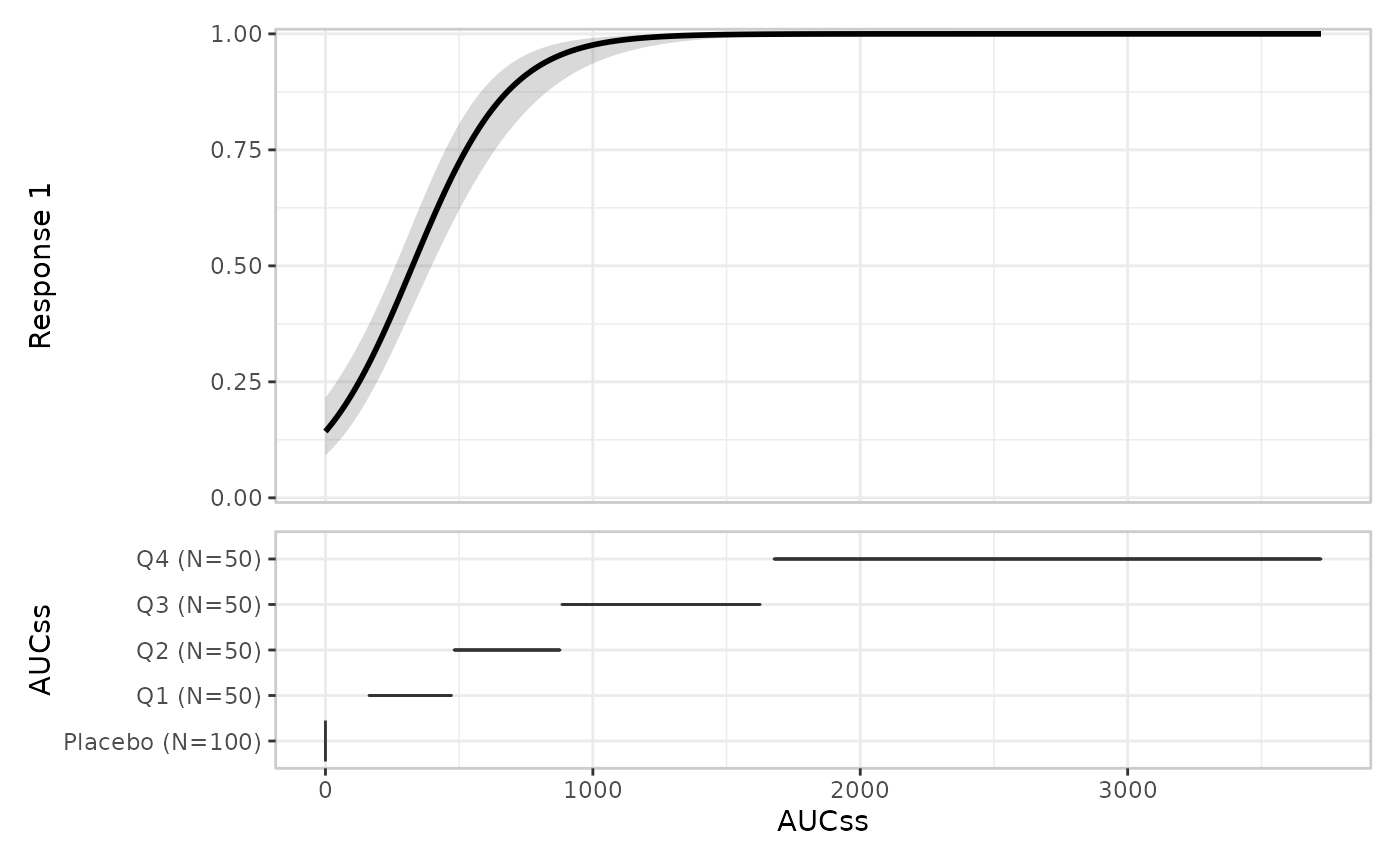
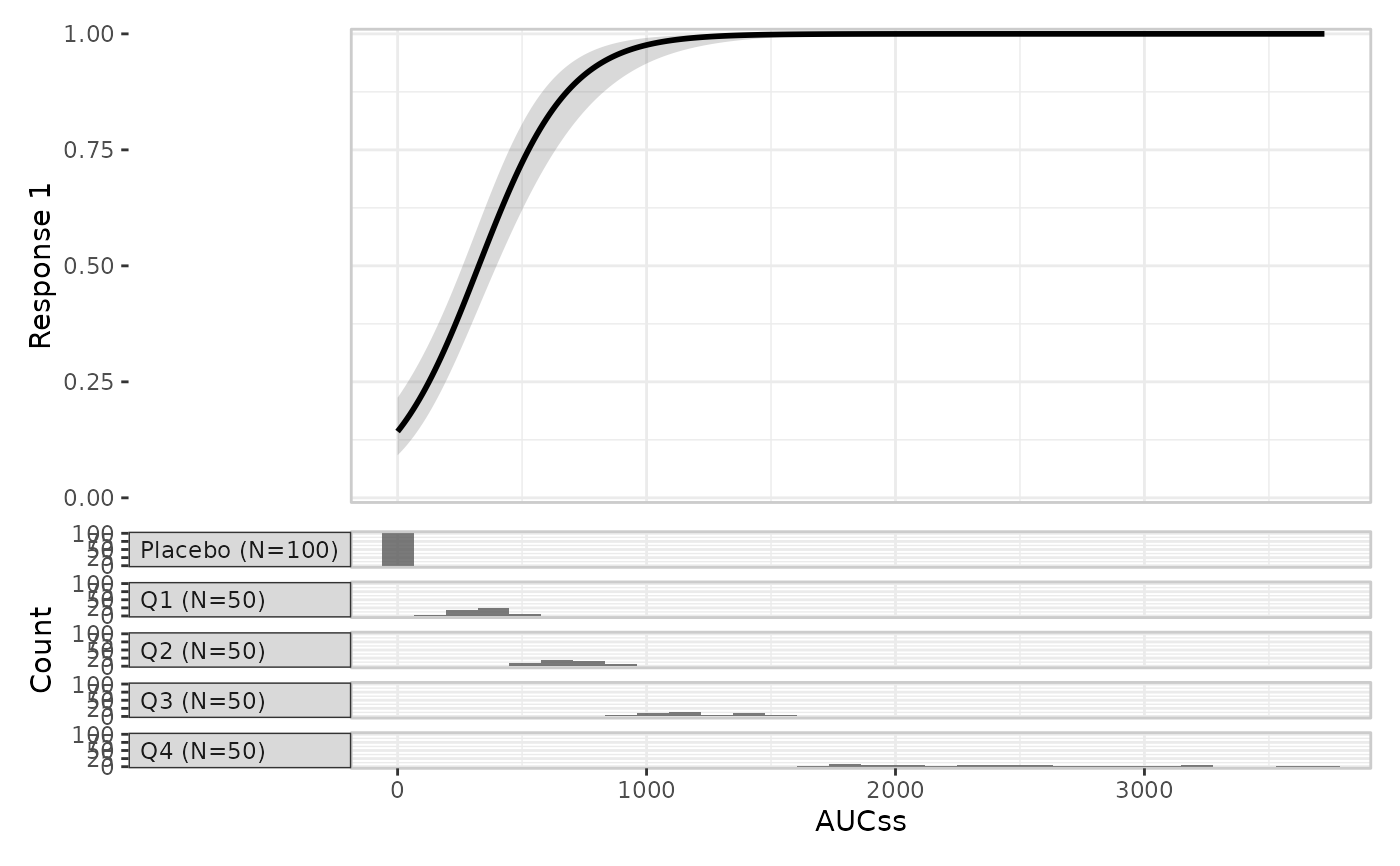
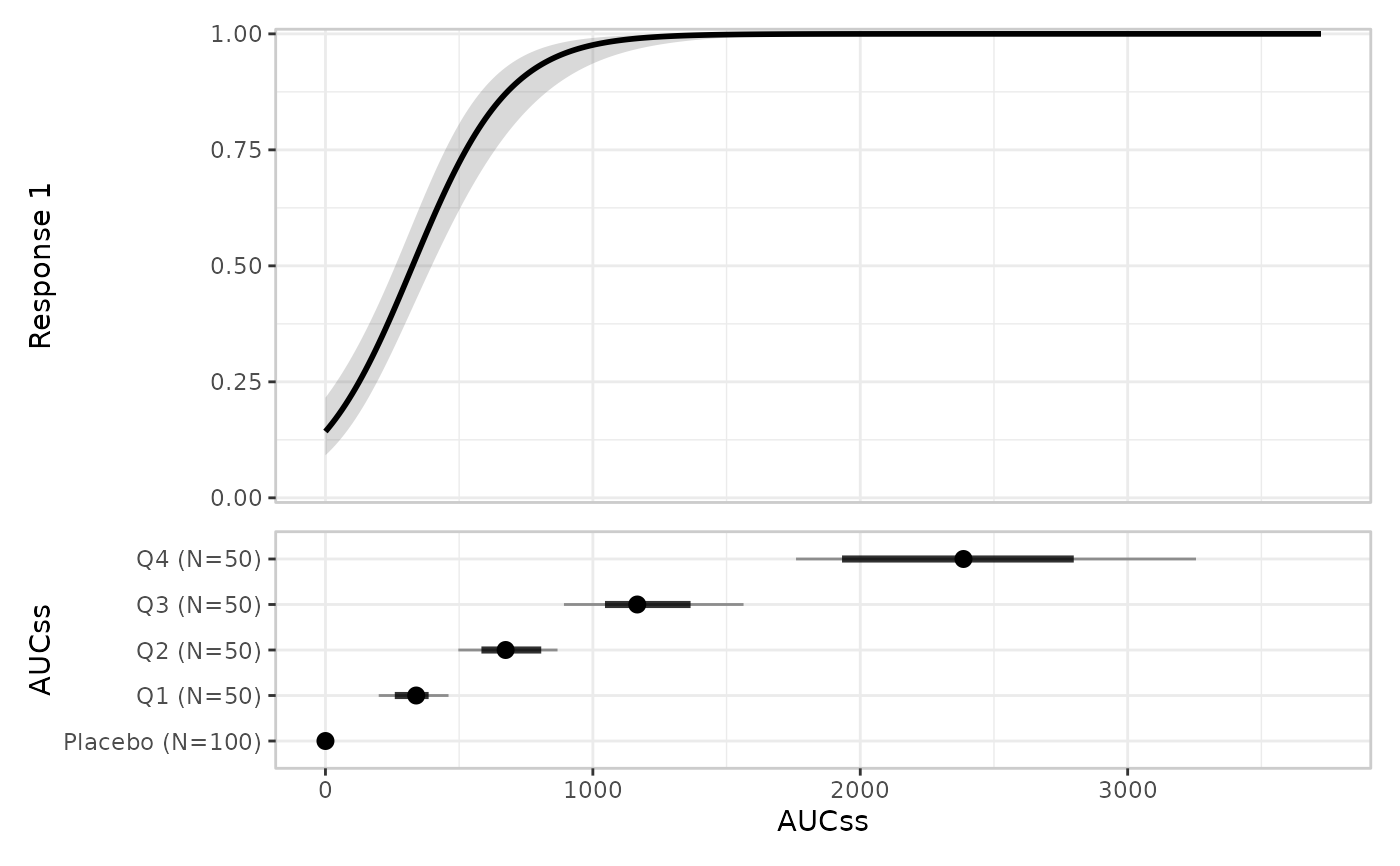
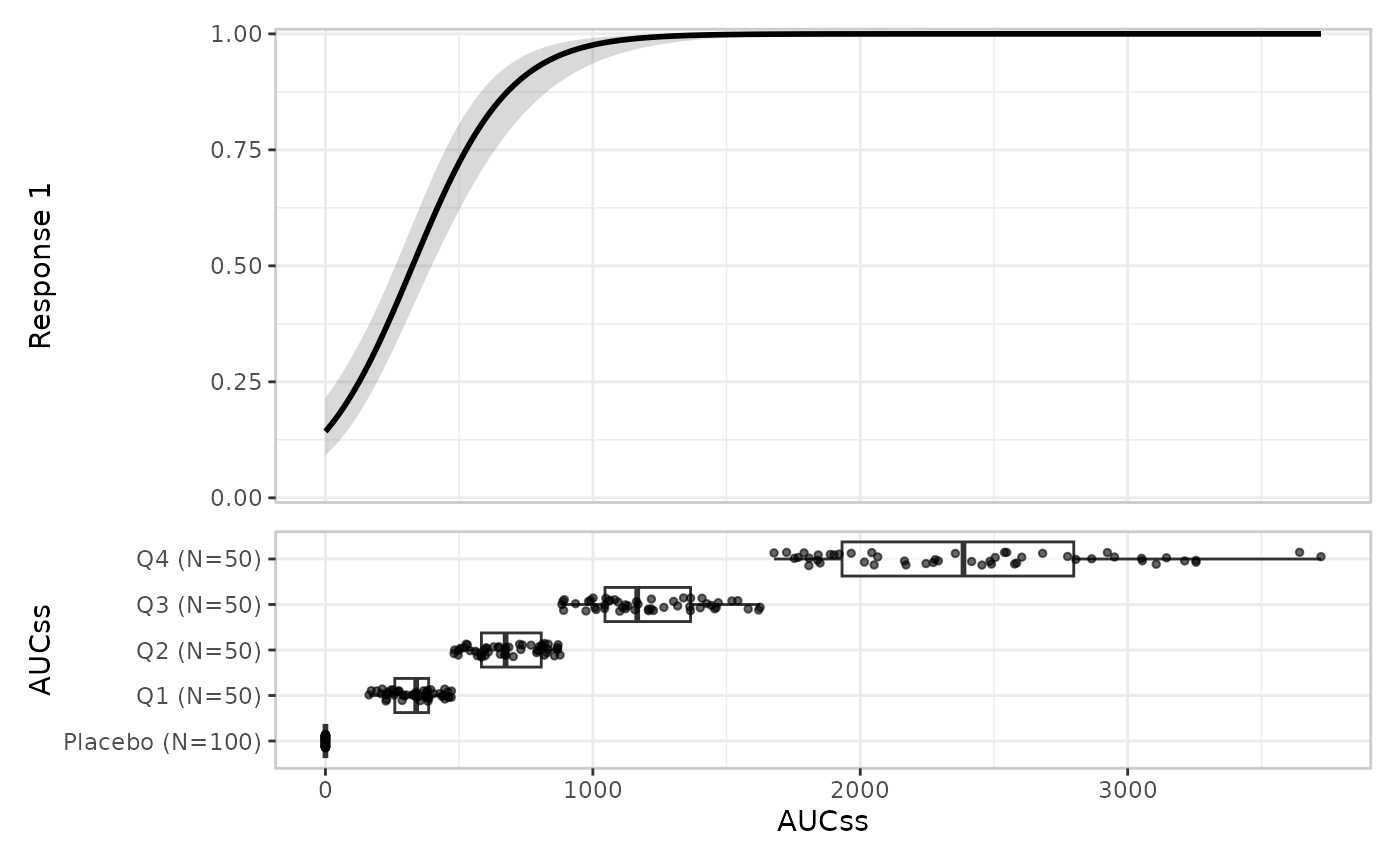
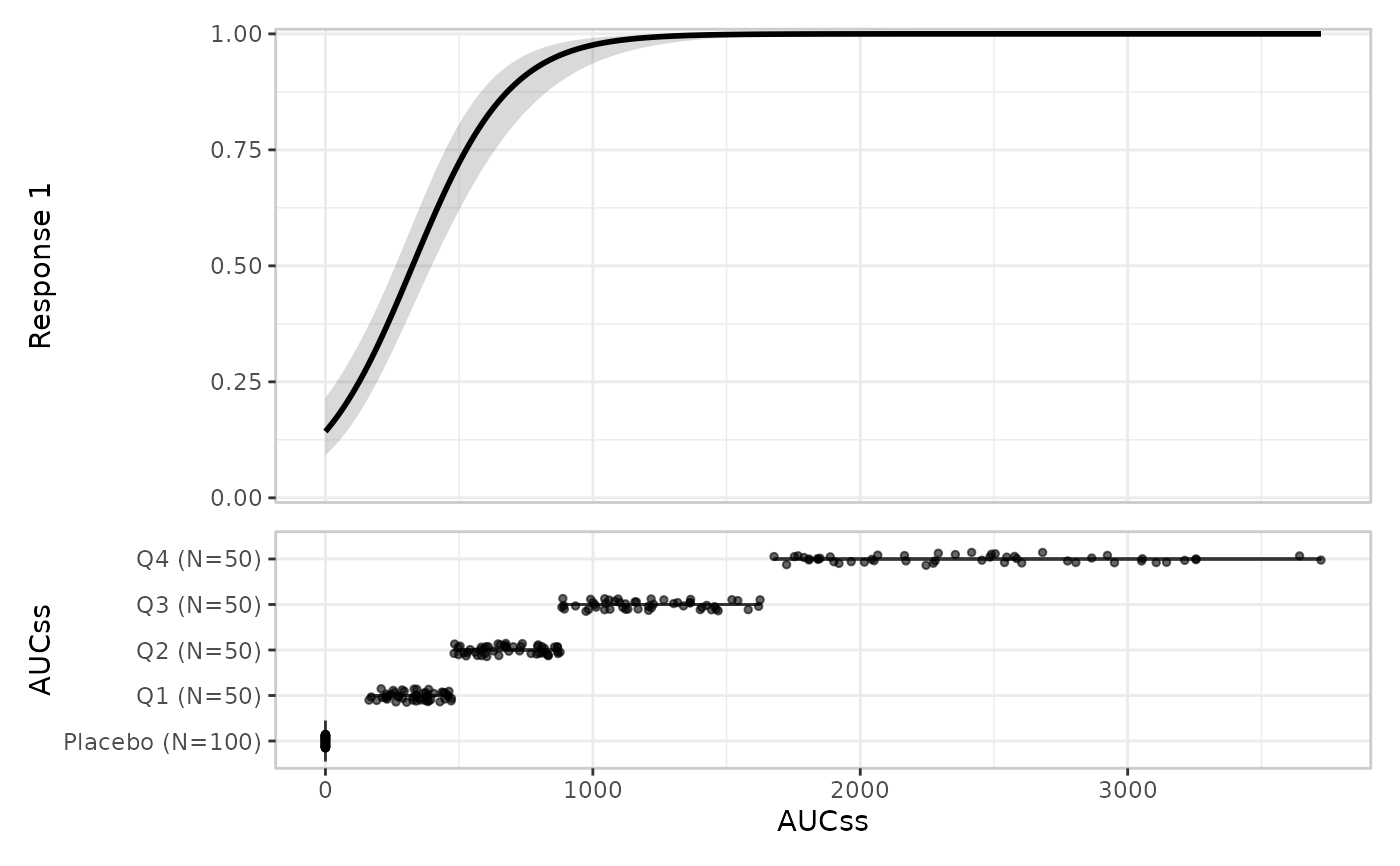
er_style_group_boxplot()(the default) – a boxplot, group levels on the y-axis.er_style_group_violin()– a violin instead of a boxplot, same axis layout.er_style_group_histogram()– group levels on facet strips instead, freeing the y-axis for counts.er_style_group_linerange()– a median dot flanked by an inner-range and outer-range line, instead of a full boxplot/violin shape; same y-axis layout as the boxplot/violin builders.er_style_group_boxjitter()/er_style_group_violinjitter()– thin wrappers arounder_style_group_boxplot()/er_style_group_violin()that additionally overlay jittered raw exposure values (see "Jittered variants" below).
All built-in group builders are tagged layer = "plot_group", so
er_plot_add_groups() errors if given one tagged for another layer.
Axis and facet layout
er_style_group_boxplot() and er_style_group_violin() put group
levels on the y-axis; er_style_group_histogram() puts them on facet
strips and frees the y-axis for counts; er_style_group_linerange()
also puts group levels on the y-axis, summarising each level's
exposure distribution as a median dot flanked by an inner-range and
outer-range line rather than a full boxplot/violin shape.
Jittered variants
er_style_group_boxjitter()/er_style_group_violinjitter() are thin
wrappers around er_style_group_boxplot()/er_style_group_violin()
that additionally overlay jittered raw exposure values (vertical
jitter only – exposure position on the x-axis is never perturbed),
the same idea er_style_data_boxjitter() applies to the data layer.
Examples
if (requireNamespace("erglm", quietly = TRUE)) {
  library(erglm)
  mod <- erglm_model(ae1 ~ aucss, erglm_data, family = binomial())

  # er_style_group_boxplot(): the default
  erglm_data |>
    er_plot(aucss, ae1) |>
    er_plot_add_model(mod) |>
    er_plot_add_groups(aucss, style = er_style_group_boxplot) |>
    plot()

  # er_style_group_violin(): a violin instead of a boxplot
  erglm_data |>
    er_plot(aucss, ae1) |>
    er_plot_add_model(mod) |>
    er_plot_add_groups(aucss, style = er_style_group_violin) |>
    plot()

  # er_style_group_histogram(): group levels on facet strips, with
  # the y-axis freed for counts
  erglm_data |>
    er_plot(aucss, ae1) |>
    er_plot_add_model(mod) |>
    er_plot_add_groups(aucss, style = er_style_group_histogram) |>
    plot()

  # er_style_group_linerange(): median dot + inner/outer range lines,
  # instead of a full boxplot/violin shape
  erglm_data |>
    er_plot(aucss, ae1) |>
    er_plot_add_model(mod) |>
    er_plot_add_groups(aucss, style = er_style_group_linerange) |>
    plot()

  # er_style_group_boxjitter(): the boxplot, with jittered raw
  # exposure values overlaid on top
  erglm_data |>
    er_plot(aucss, ae1) |>
    er_plot_add_model(mod) |>
    er_plot_add_groups(aucss, style = er_style_group_boxjitter) |>
    plot()

  # er_style_group_violinjitter(): the violin, with jittered raw
  # exposure values overlaid on top
  erglm_data |>
    er_plot(aucss, ae1) |>
    er_plot_add_model(mod) |>
    er_plot_add_groups(aucss, style = er_style_group_violinjitter) |>
    plot()
}