Summary annotation builders for the TTE grammar
Source:R/er-tte-style-summary.R
er_style_tte_summary.RdBuilder functions for the summary layer (er_tte_add_summary()),
drawing a corner-placed text/label annotation from a log-rank test
comparing survival across stratify_by's levels, a supplied model's
er_summary() result, or observation/event counts.
Usage
er_style_tte_summary_logrank(
  data,
  config,
  stratify,
  time,
  strata,
  theme,
  inset = 0.05,
  label_size = NULL,
  label_colour = NULL,
  label_fill = NULL,
  ...
)

er_style_tte_summary_n(
  data,
  config,
  stratify,
  time,
  strata,
  theme,
  inset = 0.05,
  label_size = NULL,
  label_colour = NULL,
  label_fill = NULL,
  ...
)

er_style_tte_summary_coefficients(
  data,
  config,
  stratify,
  time,
  strata,
  theme,
  inset = 0.05,
  label_size = NULL,
  label_colour = NULL,
  label_fill = NULL,
  ...
)

er_style_tte_summary_gof(
  data,
  config,
  stratify,
  time,
  strata,
  theme,
  inset = 0.05,
  fields = c("n", "aic", "bic", "r_squared"),
  label_size = NULL,
  label_colour = NULL,
  label_fill = NULL,
  ...
)
Arguments
- data
The original data frame (
object$data).- config
Configuration for the summary layer (populated by
er_tte_add_summary()):config$logrank_p_value(the log-rank test's p-value, orNULLwhen fewer than 2 strata levels are present in the data),config$summary(the supplied model's rawer_summary()result, orNULLwhen nomodelwas supplied), andconfig$corner_distance(how uncrowded each panel corner is, relative to the plotted survival curve(s) – seeer_style()'s?er_plot_add_summary()-analogous corner-placement idiom).- stratify
Logical: whether this layer was added with
keep_strata = TRUE(the default wheneverstratify_bywas set iner_tte()) – seeer_tte_add_summary().- time
object$time(name/label/limits).- strata
object$strata(var/label).- theme
object$theme–theme$format_p/theme$format_numberformat the annotation's numbers.- inset
Distance from the panel edge for the annotation label, as a fraction of the panel's width/height. Default
0.05.- label_size
Label text size. Defaults to
NULL(ggplot2::geom_label()'s own default).- label_colour
Label text colour. Defaults to
NULL(ggplot2::geom_label()'s own default).- label_fill
Label background fill. Defaults to
NULL(ggplot2::geom_label()'s own default).- ...
Additional named arguments forwarded from
er_tte_add_summary()'s own....- fields
Fields from
glanceto include forer_style_tte_summary_gof(), and the order they're shown in: one or more of"n","aic","bic", or"r_squared". Defaults to all four, in that order. A field is shown only when both present and non-NAin the model'sglanceresult.
Details
See er_style_tte() for the shared builder interface these
functions implement.
Choosing a builder
Each builder draws a different kind of annotation, with its own data requirements:
er_style_tte_summary_logrank()(the default) – a log-rank p-value comparing survival acrossstratify_by's levels. Draws nothing on an unstratified object, or one with fewer than 2 strata levels present in the data.er_style_tte_summary_n()– subject/event counts. Doesn't depend on a model orstratify_byat all.er_style_tte_summary_coefficients()– one line per row of a supplied model'scoefficientstable (seeer_summary()). Draws nothing without a model supplyingcoefficients, or if the layer is stratified.er_style_tte_summary_gof()– a single-line goodness-of-fit summary from a supplied model'sglancefield. Same requirements and restrictions aser_style_tte_summary_coefficients().
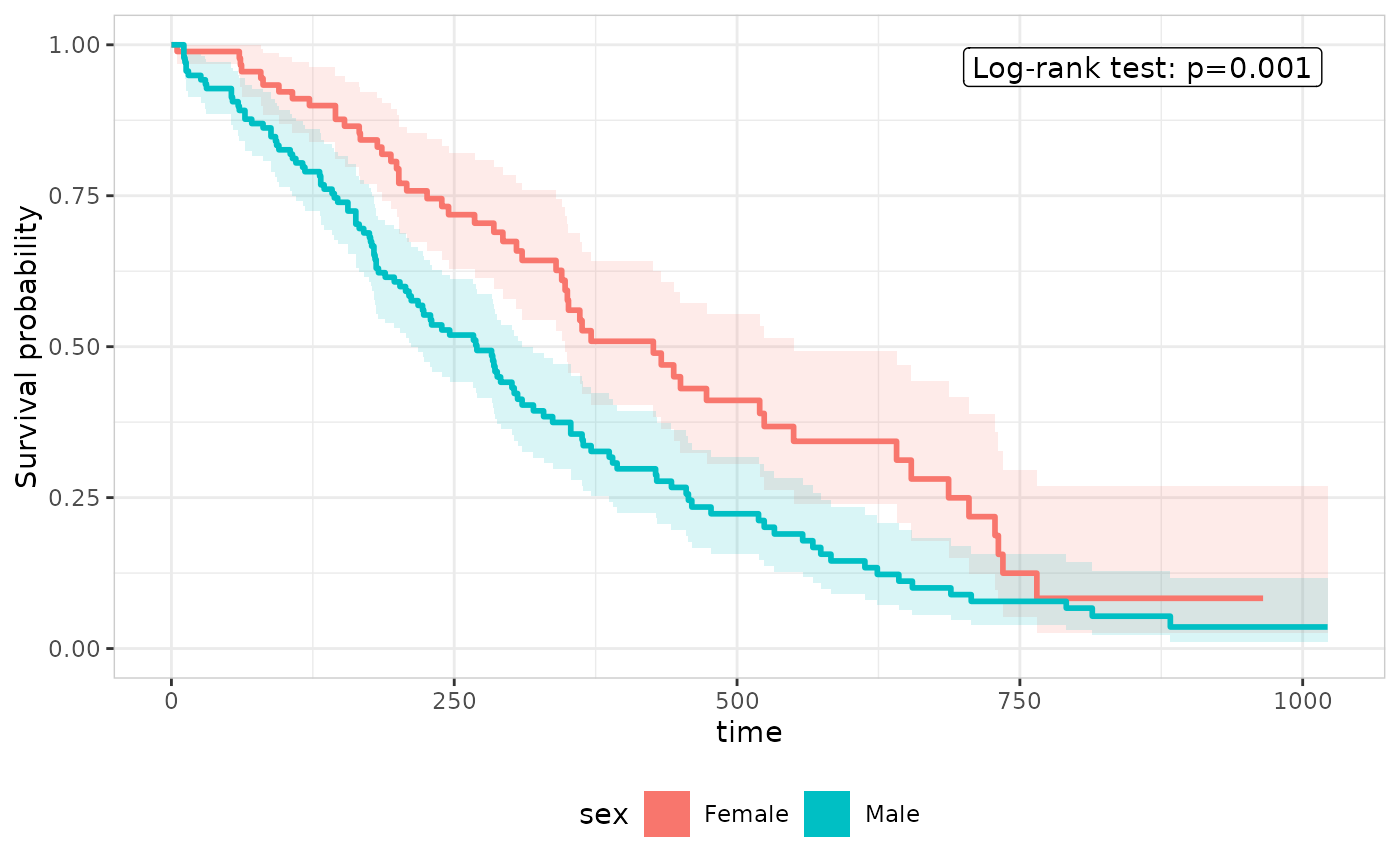
Log-rank test
er_style_tte_summary_logrank() places its annotation in whichever
of the panel's 4 corners is currently furthest from the survival
curve(s), using the same (0, 1)-rescaled corner-distance
calculation er_plot_add_summary()'s own p-value annotation uses to
avoid a plot's raw data points – here applied to the curve's own
(time, surv) coordinates instead, since there's no raw per-subject
scatter in this grammar for the annotation to avoid. It draws nothing
if config$logrank_p_value is NULL (fewer than 2 strata levels
present, including an unstratified object).
Subject and event counts
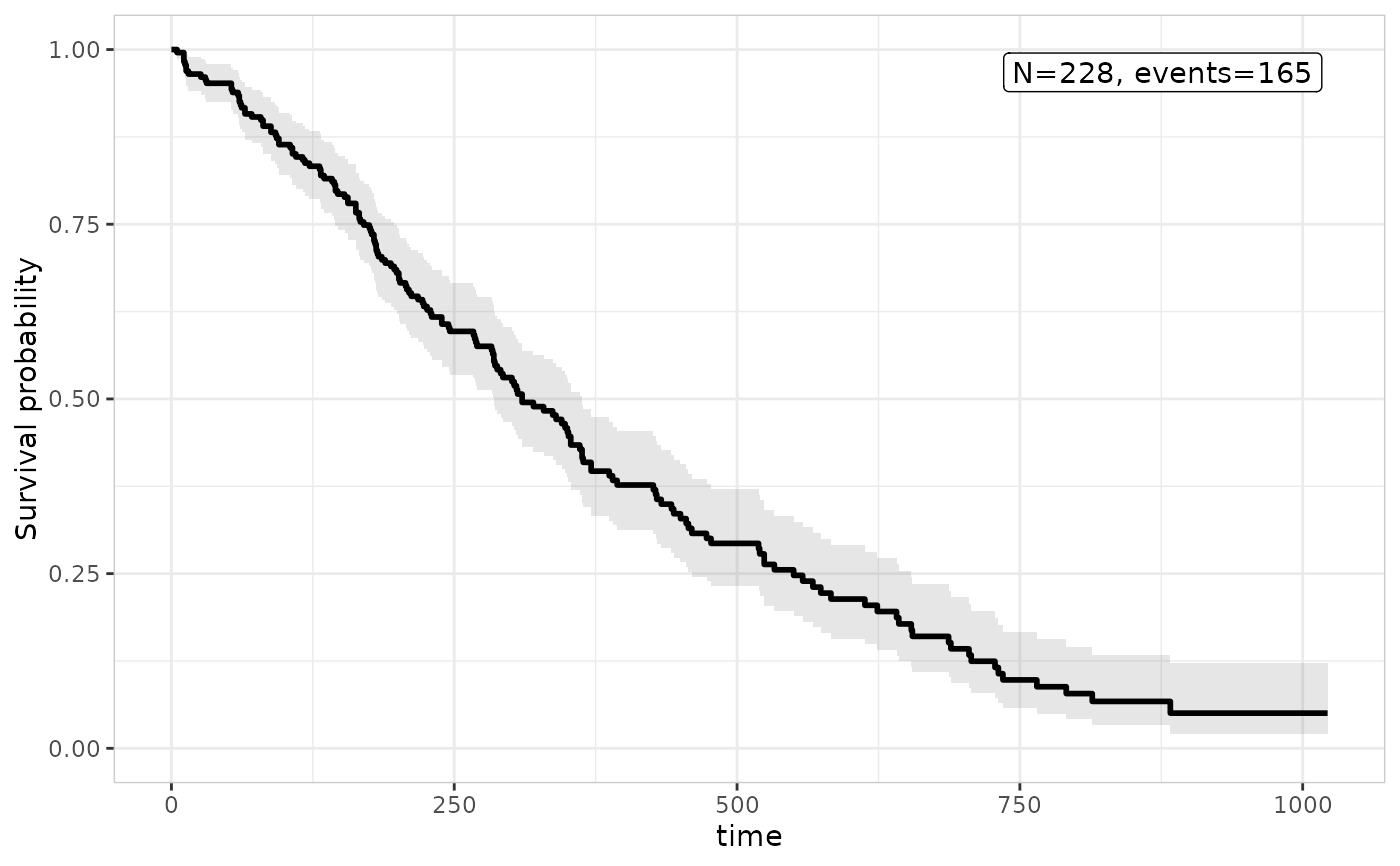
er_style_tte_summary_n() draws subject and event counts – one line
per stratum when stratify is TRUE, a single overall line
otherwise – and doesn't depend on a model or stratify_by at all.
Model coefficients and goodness-of-fit
er_style_tte_summary_coefficients() draws one line per row of the
supplied model's coefficients table (see er_summary()'s
coefficients field); it draws nothing if coefficients wasn't
supplied, or if the layer is stratified. er_style_tte_summary_gof()
draws a single-line, comma-separated goodness-of-fit annotation from
the model's glance field – a curated subset (N, AIC, BIC,
R-squared) rather than every reserved glance column, showing only
whichever of those four are actually present and non-NA; it draws
nothing if none of them are available, or if the layer is stratified.
Tags
All four builders are tagged er_style_tag(fn, layer = "tte_summary") – distinct from er_plot_add_summary()'s own
"summary" tag, since the two grammars' summary builders share no
signature (exposure/response vs. time) – so
er_tte_add_summary() errors informatively if a builder tagged for a
different layer is passed to it instead (including
er_plot_add_summary()'s own builders).
Examples
library(survival)
lung |>
transform(sex = factor(sex, labels = c("Male", "Female"))) |>
er_tte(time, status == 2, stratify_by = sex) |>
er_tte_add_curve() |>
er_tte_add_summary(style = er_style_tte_summary_logrank, label_fill = "white") |>
plot()
 # a purely descriptive annotation, with no log-rank test at all
lung |>
er_tte(time, status == 2) |>
er_tte_add_curve() |>
er_tte_add_summary(style = er_style_tte_summary_n) |>
plot()
# a purely descriptive annotation, with no log-rank test at all
lung |>
er_tte(time, status == 2) |>
er_tte_add_curve() |>
er_tte_add_summary(style = er_style_tte_summary_n) |>
plot()