Adds the summary layer to a TTE plot: a corner-placed text/label annotation, summarising one or more aspects of the plot or the data.
Usage
er_tte_add_summary(
  object,
  model = NULL,
  style = NULL,
  keep_strata = NULL,
  conf_level = 0.95,
  summary_args = list(),
  ...
)
Arguments
- object
Partially constructed plot (has S3 class
er_tte).- model
A fitted time-to-event model implementing
er_summary(), orNULL(the default). Only needed for styles that produce model-based summaries, ignored by other style builder functions.- style
Style used to produce the summary layer annotation. Can either be a string corresponding to one of the registered style labels (e.g.,
"logrank", the default), or a builder function used to compute the relevant plot object (see "Styles" below).- keep_strata
Logical; whether this layer should use stratification. Defaults to
TRUEwhen a stratification variable has been specified, andFALSEotherwise.- conf_level
Confidence level forwarded to
er_summary()(see?er_model_interface). Defaults to0.95. Ignored whenmodelisNULL.- summary_args
A named list of additional arguments forwarded to
er_summary()when generating summaries.- ...
Additional named arguments forwarded to the
stylebuilder function when the plot is built.
Details
The annotation is placed in whichever corner of the panel is
currently furthest from the plotted survival curve(s), computed the
same way er_plot_add_summary()'s corner-placed annotation avoids
the raw data – see er_style_tte_summary_logrank().
The default log-rank builder draws nothing on an unstratified object,
or one with only 1 stratum level present in the data, rather than
erroring – a log-rank test needs at least 2 groups to compare. Other
builders (e.g. er_style_tte_summary_n()) work regardless of
stratification.
Styles
The following pre-defined styles are available for this layer. Please see the documentation for the corresponding builder function to see what customisation options are available:
| Label | Builder | Description |
"logrank" | er_style_tte_summary_logrank() | Log-rank test p-value comparing survival across stratify_by's levels (the default). |
"n" | er_style_tte_summary_n() | Subject/event counts; model- and stratification-agnostic. |
"coefficients" | er_style_tte_summary_coefficients() | One line per model parameter, from model's er_summary() coefficients table. |
"gof" | er_style_tte_summary_gof() | A goodness-of-fit annotation from model's er_summary() glance table. |
See er_style_tte() for details on how style builder functions are
defined for the TTE mini-grammar, should a custom style be required.
Examples
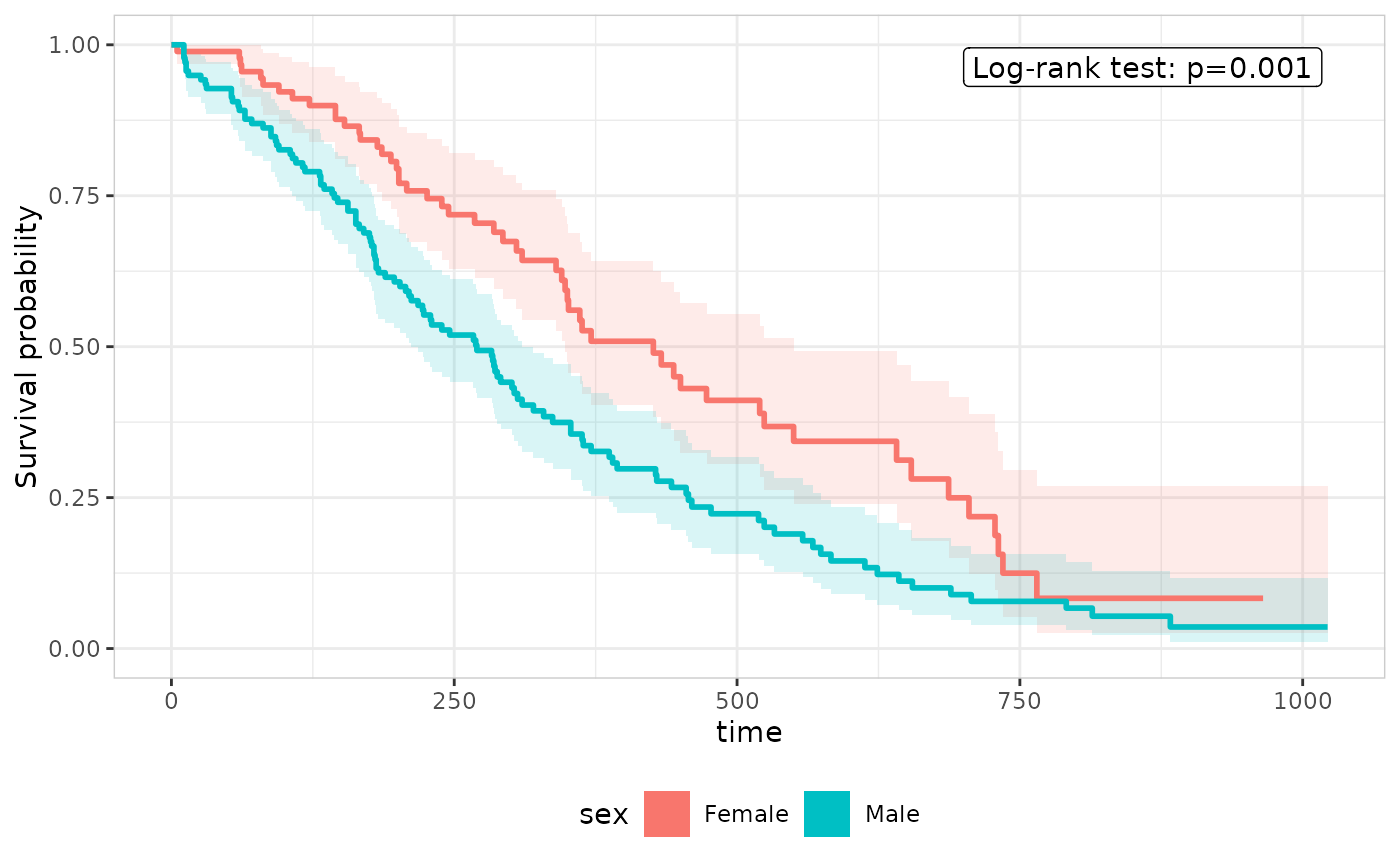
library(survival)
lung |>
transform(sex = factor(sex, labels = c("Male", "Female"))) |>
er_tte(time, status == 2, stratify_by = sex) |>
er_tte_add_curve() |>
er_tte_add_summary() |>
plot()
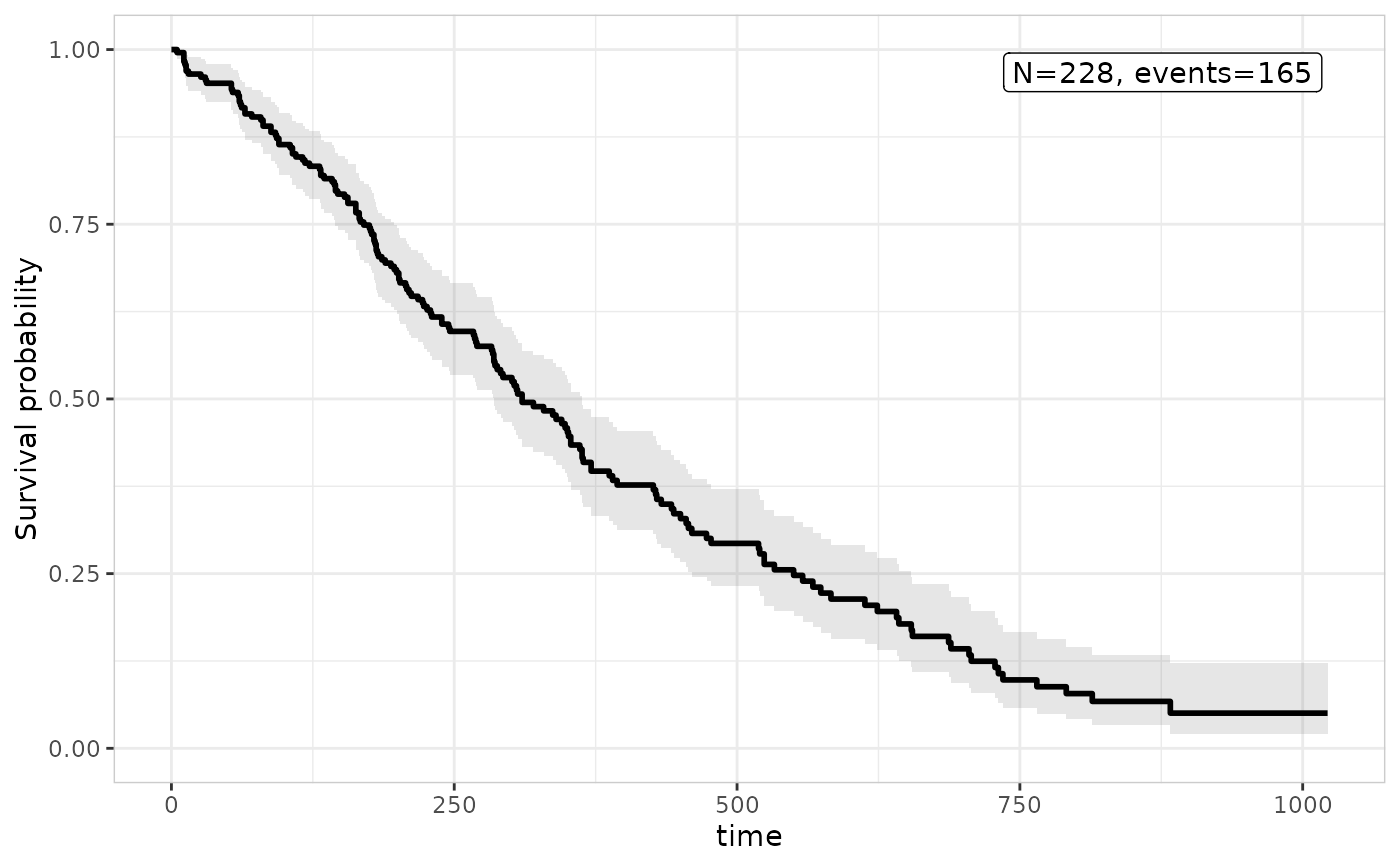
 # a purely descriptive annotation, with no model or log-rank test at all
lung |>
er_tte(time, status == 2) |>
er_tte_add_curve() |>
er_tte_add_summary(style = er_style_tte_summary_n) |>
plot()
# a purely descriptive annotation, with no model or log-rank test at all
lung |>
er_tte(time, status == 2) |>
er_tte_add_curve() |>
er_tte_add_summary(style = er_style_tte_summary_n) |>
plot()