Builder functions for the simulated layer (er_vpc_add_simulated()),
drawing the simulated side of a visual predictive check as a
mean + percentile interval per bin (the default, adaptive to
plot_by's type), continuous-x percentile bands, or a
point/interval per bin and per requested percentile.
Usage
er_style_vpc_simulated_quantile_ribbon(
  data,
  config,
  exposure,
  response,
  theme,
  ribbon_alpha = 0.3,
  ribbon_edges = FALSE,
  edge_linetype = "dotted",
  edge_linewidth = 0.5,
  edge_colour = "grey50",
  median_linetype = "dashed",
  median_linewidth = 0.5,
  median_colour = "grey30",
  ...
)

er_style_vpc_simulated_quantile_errorbar(
  data,
  config,
  exposure,
  response,
  theme,
  point_size = 1.5,
  errorbar_width = NULL,
  dodge = 0,
  prob_dodge_width = 0,
  ...
)

er_style_vpc_simulated_mean_errorbar(
  data,
  config,
  exposure,
  response,
  theme,
  point_size = 2,
  errorbar_width = NULL,
  dodge = 0,
  show_label = FALSE,
  label_size = 3,
  ...
)
Arguments
- data
The original data frame.
- config
Configuration for the simulated layer.
- exposure
Exposure variable.
- response
Response variable.
- theme
Theme components.
- ribbon_alpha
Fill transparency for
er_style_vpc_simulated_quantile_ribbon()'s bands. Defaults to0.3.- ribbon_edges
Whether
er_style_vpc_simulated_quantile_ribbon()additionally draws a line along each band's ownci_lower/ci_upperbounds, on top of the shaded ribbon fill – mirrorser_style_model_ribbonline()'s ownribbon_edgesargument. DefaultFALSE(ribbon fill only). Useful when several requested percentiles' bands overlap: the edge lines stay legible even where the fills merge into an indistinguishable blob.- edge_linetype, edge_linewidth, edge_colour
Styling for
er_style_vpc_simulated_quantile_ribbon()'s optional edge lines (only drawn whenribbon_edges = TRUE). Defaults to a thin, light dotted line ("dotted",0.5,"grey50") that stays unobtrusive even when several bands' edges overlap.- median_linetype, median_linewidth, median_colour
Styling for
er_style_vpc_simulated_quantile_ribbon()'s median line, drawn at each band'sy_mid. Defaults match the previous fixed styling ("dashed",0.5,"grey30").- ...
Additional named arguments forwarded from
er_vpc_add_simulated()'s own....- point_size
Point size for both point/interval builders. Defaults to
1.5forer_style_vpc_simulated_quantile_errorbar(), or2forer_style_vpc_simulated_mean_errorbar().- errorbar_width
Width of
er_style_vpc_simulated_mean_errorbar()'s ander_style_vpc_simulated_quantile_errorbar()'s error bars. Interpreted differently depending onplot_by's type: for a categoricalplot_by, it's a bar width in the same implied unit-scaled category-gap unitsggplot2::geom_errorbar()normally expects; for a numericplot_by, it's a fraction ofplot_by's own range (config$group_limits), so1would span the full range. Defaults toNULL, which resolves to0.15(er_style_vpc_simulated_quantile_errorbar()) or0.2(er_style_vpc_simulated_mean_errorbar()) for a categoricalplot_by, or0.025for a numeric one.- dodge
Horizontal offset (as a fraction of
plot_by's own range, likeerrorbar_widthfor a numericplot_by) applied to all of this builder's error bars/points, for bother_style_vpc_simulated_mean_errorbar()ander_style_vpc_simulated_quantile_errorbar(). Default0(no offset, the previous behaviour); pair with an opposite-signeddodgeon the corresponding observed builder to manually separate the two layers where they'd otherwise overlap at the same bin. Seeer_style_vpc_observed()'s owndodgedocs for the full explanation, including the categorical-plot_byrestriction.- prob_dodge_width
Horizontal spread (as a fraction of
plot_by's own range) applied toer_style_vpc_simulated_quantile_errorbar()'s requestedprobswithin a single bin. Default0(the previous behaviour); seeer_style_vpc_observed()'s ownprob_dodge_widthdocs.- show_label
For
er_style_vpc_simulated_mean_errorbar()only: whether to drawconfig$summary'sy_mid_lbl(the mean, formatted viaer_vpc_theme()'sformat_percent/format_number) as a text label just above each point's upper CI bound. DefaultFALSE(no label, the previous behaviour); seeer_style_vpc_observed()'s ownshow_labeldocs.- label_size
Text size for
show_label's label. Defaults to3.
Value
A list of geoms; see er_style().
Details
See er_style_vpc() for the shared interface every VPC-grammar
builder implements.
Choosing a builder
All three builders plot the simulated side of a bin against the
observed side drawn by their er_style_vpc_observed() counterpart;
which one to reach for depends on how much of the response's
distribution you need to see, and what kind of response/plot_by
you have:
er_style_vpc_simulated_mean_errorbar()(the default) – one point + percentile interval per bin, summarising the mean only. Works for every response type and either kind ofplot_by. Start here unless you specifically need percentile bands.er_style_vpc_simulated_quantile_ribbon()– a shaded band per requested percentile, for a fuller picture of the response's distribution across bins. Requires a continuous/count response and a numericplot_by; pairs wither_style_vpc_observed_quantile_line().er_style_vpc_simulated_quantile_errorbar()– a point + interval per requested percentile per bin, the discrete-bin analogue of the ribbon idiom above. Same response-type restriction, but also works with a categoricalplot_by; pairs wither_style_vpc_observed_quantile_errorbar().
Mean/errorbar (default)
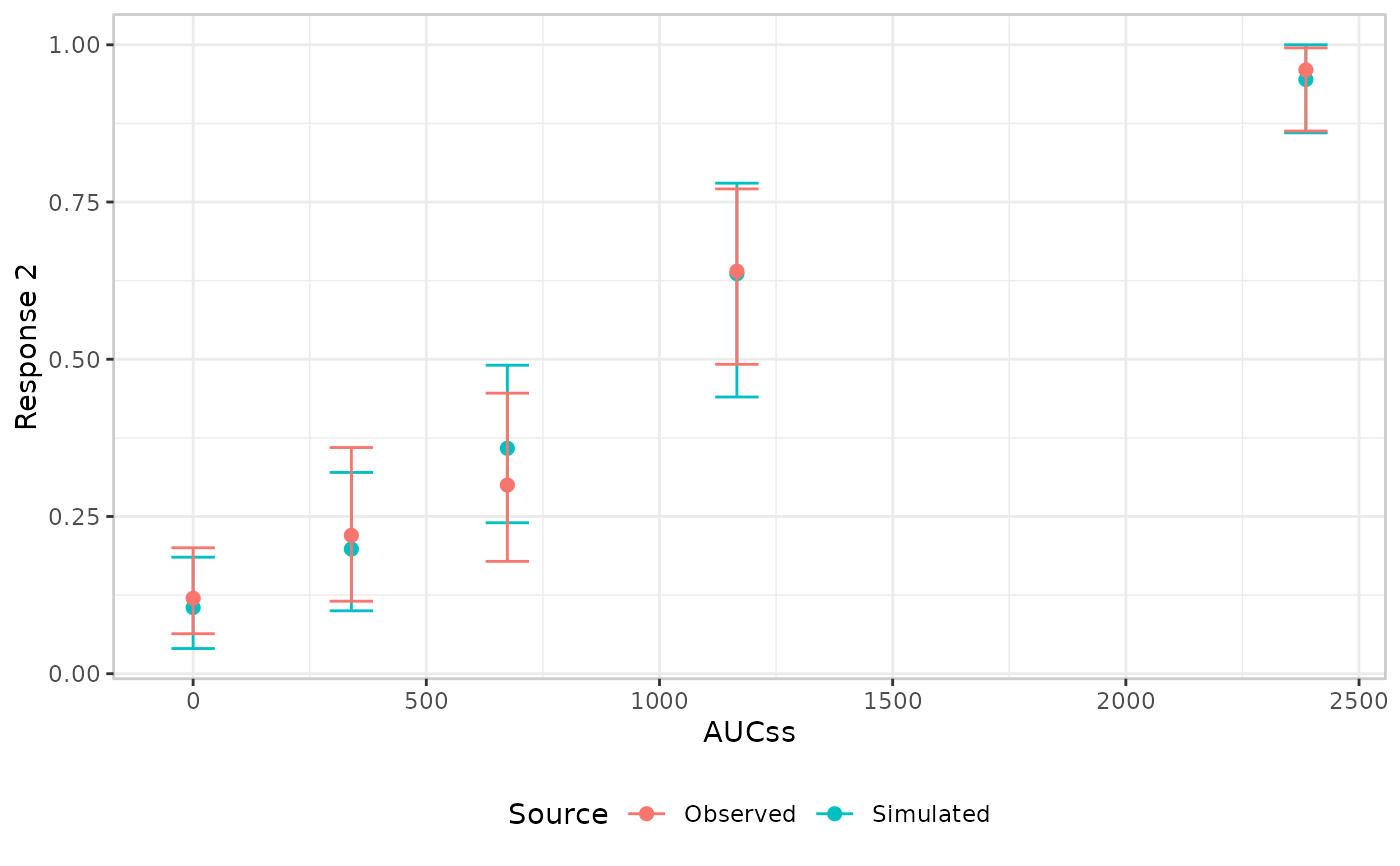
er_style_vpc_simulated_mean_errorbar() plots config$summary's
mean + percentile interval (of the mean, across replicates), adapting
its x-position to plot_by's type (config$is_numeric_group):
equally spaced at each bin's categorical (or quantile-bin) label when
plot_by is categorical, or at each bin's numeric median (x_median,
from config$summary) on the plot_by's own numeric scale when
plot_by is numeric. Because it adapts its x-position family at
build time rather than declaring one statically, it carries no
vpc_layout tag – pair it with
er_style_vpc_observed_mean_errorbar(), which mirrors the same
adaptive logic.
Percentile ribbon
er_style_vpc_simulated_quantile_ribbon() plots config$percentiles
– one shaded band (median line + interval) per requested percentile
– at each bin's numeric midpoint on plot_by's own numeric scale, for pairing
with er_style_vpc_observed_quantile_line(). config$percentiles is
only computed for a continuous/count response (see er_vpc()'s
probs argument); calling er_style_vpc_simulated_quantile_ribbon()
without it errors.
Percentile errorbar
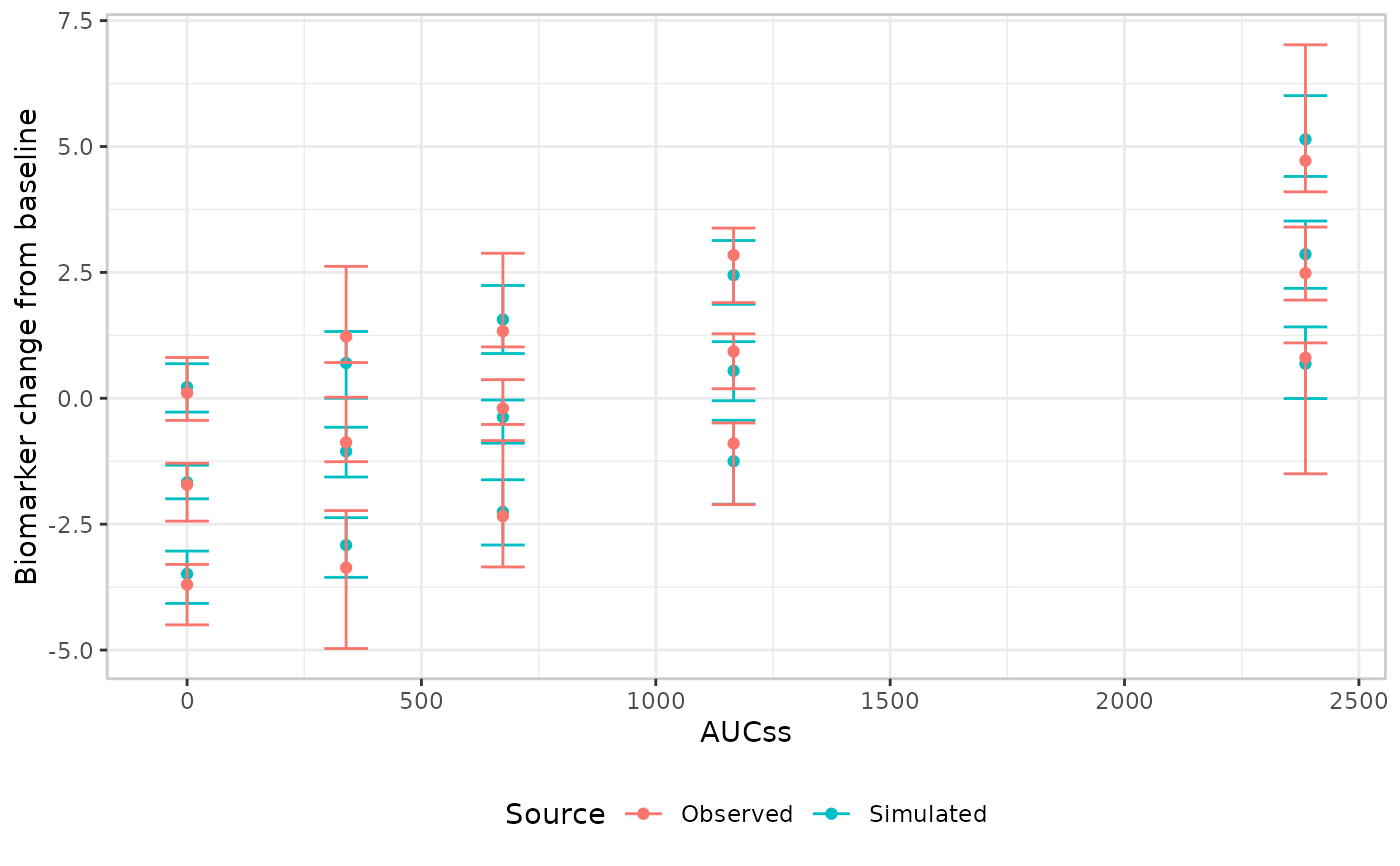
er_style_vpc_simulated_quantile_errorbar() plots config$percentiles
– a point + across-replicate percentile interval for each requested
percentile – for pairing with
er_style_vpc_observed_quantile_errorbar(). Like that builder (and
like er_style_vpc_simulated_mean_errorbar()), it adapts its
x-position to plot_by's type, carries no vpc_layout tag, supports
both a numeric and a categorical plot_by, and requires a
continuous/count response, erroring informatively without
config$percentiles. As with the observed-layer counterpart, when
more than one percentile is requested they are currently all plotted
at the same x-position within a bin rather than dodged apart.
Legends and overlap
er_style_vpc_simulated_mean_errorbar()/er_style_vpc_simulated_quantile_errorbar()
map a constant color = "Simulated"; er_style_vpc_simulated_quantile_ribbon()
maps a constant fill = "Simulated". ggplot2 merges either into the
paired observed builder's own "Observed" legend entry (same
aesthetic) into one combined legend; the ribbon's fill legend is
separate from the point/errorbar builders' color legend.
When several requested percentiles' bands sit close together (small
per-bin samples, few simulated replicates, or probs values close to
one another), er_style_vpc_simulated_quantile_ribbon()'s bands can
overlap enough that the shaded fills merge into a single
indistinguishable region, and its median lines – all styled
identically – become the only way to tell the bands apart, which
fails wherever two of them cross. ribbon_edges = TRUE mitigates this
by drawing each band's own ci_lower/ci_upper bounds as a line (see
edge_linetype/edge_linewidth/edge_colour), which stays legible
even where the fills themselves are illegible.
Examples
if (requireNamespace("erglm", quietly = TRUE)) {
  library(erglm)
  mod <- erglm_model(ae2 ~ aucss + sex, erglm_data, family = binomial())

  # er_style_vpc_simulated_mean_errorbar(): the default, adaptive to
  # plot_by's type
  erglm_data |>
    er_vpc(aucss, ae2, plot_by = aucss) |>
    er_vpc_add_observed(style = er_style_vpc_observed_mean_errorbar) |>
    er_vpc_add_simulated(model = mod, seed = 6203, style = er_style_vpc_simulated_mean_errorbar) |>
    plot()

  # er_style_vpc_simulated_quantile_errorbar(): a point + interval per
  # requested percentile, paired with the matching observed builder
  mod2 <- erglm_model(biomarker_change ~ aucss, erglm_data, family = gaussian())
  erglm_data |>
    er_vpc(aucss, biomarker_change, plot_by = aucss) |>
    er_vpc_add_observed(style = er_style_vpc_observed_quantile_errorbar) |>
    er_vpc_add_simulated(
      model = mod2, seed = 8417, style = er_style_vpc_simulated_quantile_errorbar
    ) |>
    plot()
}