Set axis/legend labels, plot titles/captions, axis limits, theme objects, discrete and continuous scale objects, formatters, legend key glyph, and relative panel heights. This does not change which variable is mapped to which aesthetic.
Usage
er_plot_theme(
  object,
  xlab = NULL,
  ylab = NULL,
  strata_lab = NULL,
  title = NULL,
  subtitle = NULL,
  caption = NULL,
  xlim = NULL,
  ylim = NULL,
  theme_base = NULL,
  theme_extra = NULL,
  color_discrete = NULL,
  fill_discrete = NULL,
  color_continuous = NULL,
  fill_continuous = NULL,
  format_p = NULL,
  format_percent = NULL,
  format_number = NULL,
  draw_key = NULL,
  dodge_width = NULL,
  height_base = NULL,
  height_data = NULL,
  height_group = NULL
)
Arguments
- object
Partially constructed plot (has S3 class
er_plot)- xlab, ylab
Exposure/response axis label (single string).
- strata_lab
Stratification legend label (single string). Errors if
stratify_bywasn't set iner_plot()– there's no stratification legend to label.- title, subtitle, caption
Plot-level annotation text (single strings), applied via
patchwork::plot_annotation()iner_plot_build().- xlim, ylim
Exposure/response axis limits (length-2, increasing numeric vectors, no
NA). These are read lazily by every builder at build time, so it doesn't matter whetherer_plot_theme()is called before or after the layers that use them. Unlikeggplot2::coord_cartesian()'sxlim/ylim,NAisn't accepted for either endpoint:object$exposure$limits/object$response$limitsalso drive non-cosmetic computations (e.g. the model curve's prediction grid, quantile-bin boundaries), where aNAbound has no well-defined meaning.- theme_base
A ggplot2 theme object (e.g.
ggplot2::theme_minimal()) – the swappable overall visual theme, defaulting toggplot2::theme_bw().- theme_extra
A ggplot2 theme object (e.g. from
ggplot2::theme()) with additional theme tweaks layered on top oftheme_base. See "Details" for its default and replacement semantics.- color_discrete, fill_discrete
A discrete ggplot2 scale object (e.g.
ggplot2::scale_color_brewer(),ggplot2::scale_fill_viridis_d()), applied to every plot whosecolour/fillaesthetic is mapped to the stratification variable – see "Details".- color_continuous, fill_continuous
A continuous ggplot2 scale object (e.g.
ggplot2::scale_color_viridis_c(),ggplot2::scale_fill_gradient()), applied to every plot whosecolour/fillaesthetic is mapped to something continuous other than the stratification variable – see "Details".- format_p, format_percent, format_number
Formatter functions (typically from
scales::label_*()). Used by the summary/quantile layers to format p-values/rates/means for display. Default toscales::label_pvalue(accuracy = .001, add_p = TRUE),scales::label_percent(accuracy = 1), andscales::label_number(accuracy = 0.01)respectively.- draw_key
A key-glyph function (e.g.
ggplot2::draw_key_point()), passed as every geom'skey_glyphargument. Defaults toggplot2::draw_key_rect().- dodge_width
Spacing between adjacent strata's horizontal offset in the quantile layer, as a fraction of the exposure range. A single positive number; see "Details".
- height_base, height_data, height_group
Relative panel heights (single positive numbers), for the base plot, data-layer panel(s), and group-layer panel(s) respectively. Default to
6,2, and3. Supplying only one leaves the other two unchanged.
Details
dodge_width is a stratification-layout setting used by
er_style_quantile_errorbar()/er_style_quantile_pointrange() (and
their _vlines variants) to separate strata horizontally within each
quantile bin. It belongs in er_plot_theme() because dodging is about
stratification layout, not an individual builder's visual style.
Defaults to 0.015 (set in er_plot()).
Every argument defaults to NULL, meaning "leave whatever was set
before unchanged". This allows repeated calls to er_plot_theme() to
update only the supplied fields, like ggplot2::theme(). There is no
implicit way to reset a field to the er_plot() default.
color_discrete/fill_discrete apply only when a layer's colour/
fill aesthetic is mapped to stratification. Their continuous
counterparts, color_continuous/fill_continuous, apply only when the
aesthetic is mapped to a continuous quantity such as density or a
continuous/count response value. If a custom builder adds its own scale,
supplying one of these four will add a second scale and let ggplot2
choose the later one.
theme_extra defaults to a panel border plus legend.position = "bottom". Supplying a new value fully replaces this default rather
than merging with it, so re-include the border/legend-position
settings too if you want to keep them alongside your own additions.
Examples
if (requireNamespace("erglm", quietly = TRUE)) {
  library(erglm)
  mod <- erglm_model(ae1 ~ aucss, erglm_data, family = binomial())

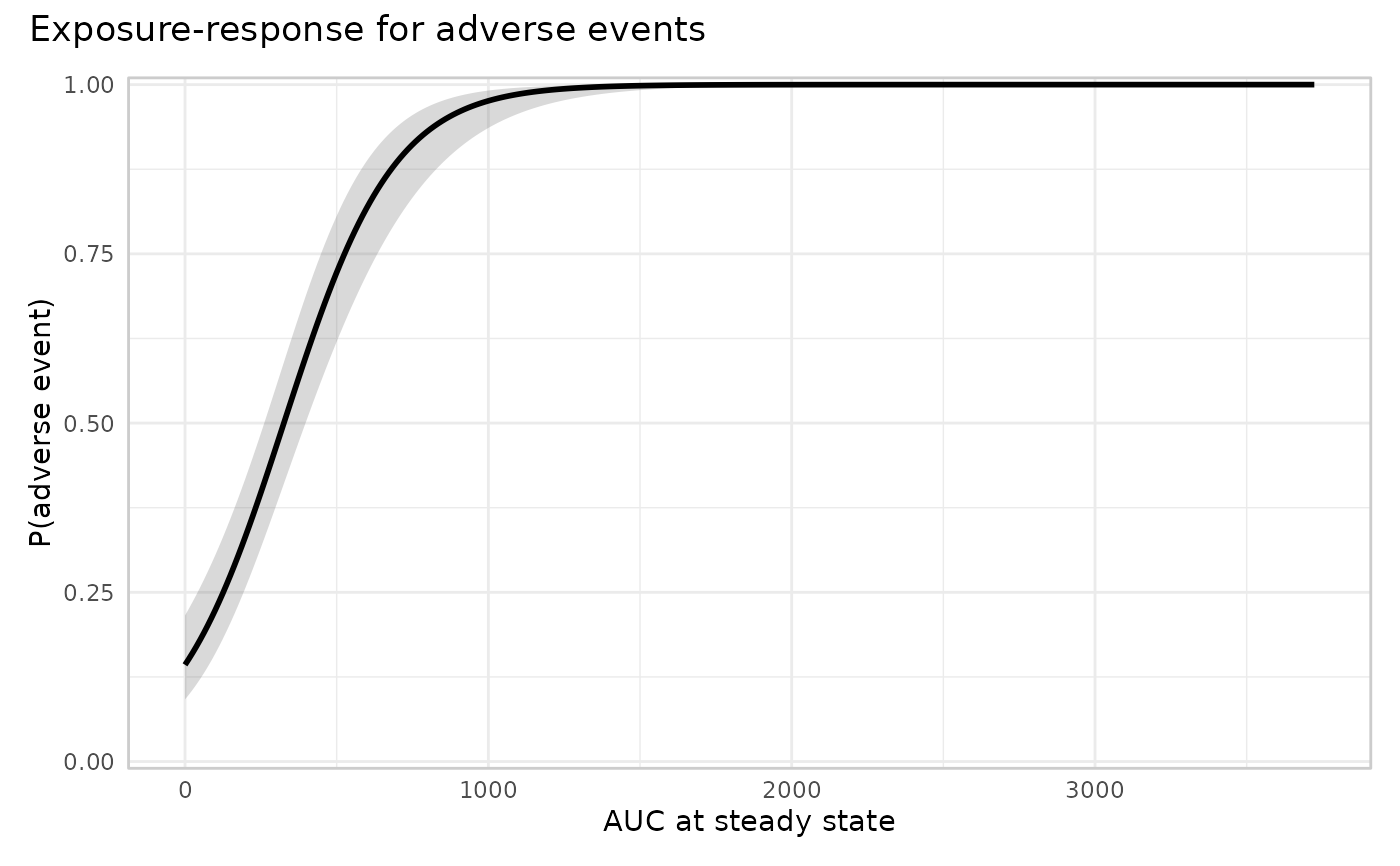
  # axis labels, a title, and a swapped-in theme
  erglm_data |>
    er_plot(aucss, ae1) |>
    er_plot_add_model(mod) |>
    er_plot_theme(
      xlab = "AUC at steady state",
      ylab = "P(adverse event)",
      title = "Exposure-response for adverse events",
      theme_base = ggplot2::theme_minimal()
    ) |>
    plot()

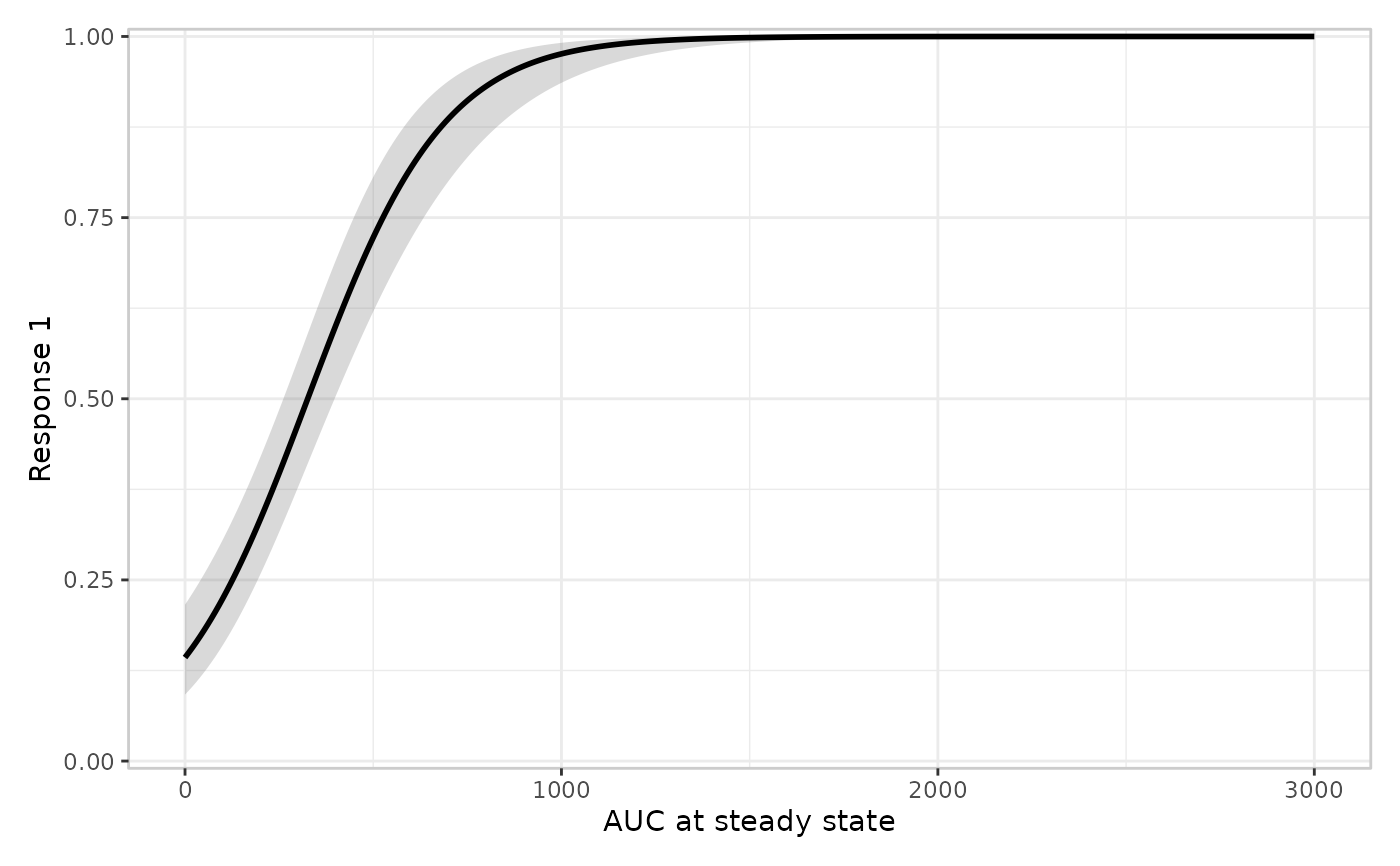
  # repeated calls accumulate: this only touches xlim/ylim, leaving
  # the labels/title/theme set above unchanged
  erglm_data |>
    er_plot(aucss, ae1) |>
    er_plot_add_model(mod) |>
    er_plot_theme(xlab = "AUC at steady state") |>
    er_plot_theme(xlim = c(0, 3000)) |>
    plot()

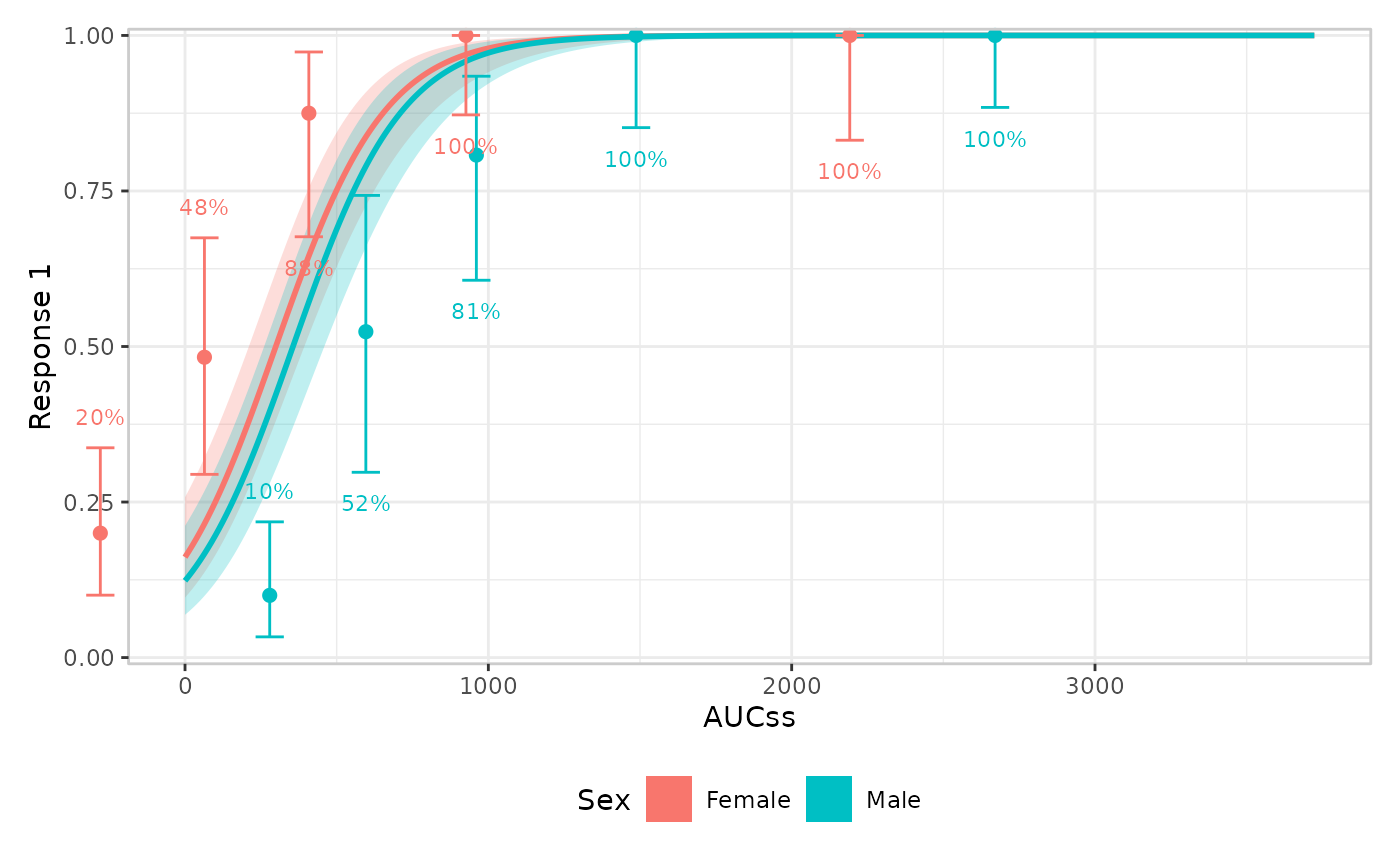
  # widening the stratum-dodge spacing in a stratified quantile layer
  mod2 <- erglm_model(ae1 ~ aucss + sex, erglm_data, family = binomial())
  erglm_data |>
    er_plot(aucss, ae1, stratify_by = sex) |>
    er_plot_add_model(mod2) |>
    er_plot_add_quantiles() |>
    er_plot_theme(dodge_width = 0.15, strata_lab = "Sex") |>
    plot()
}