Quantile summary builders for exposure-response plots
Source:R/er-plot-style-quantile.R
er_style_quantile.RdBuilder functions for the quantile layer (er_plot_add_quantiles()),
drawing a point/interval summary per exposure quantile bin as an error bar
or a pointrange, optionally with bin-boundary vlines.
Usage
er_style_quantile_errorbar(
  data,
  config,
  stratify,
  exposure,
  response,
  strata,
  theme,
  point_size = 2,
  errorbar_width = 0.025,
  label_size = 3,
  ...
)

er_style_quantile_errorbar_vlines(
  data,
  config,
  stratify,
  exposure,
  response,
  strata,
  theme,
  point_size = 2,
  errorbar_width = 0.025,
  label_size = 3,
  vline_colour = "grey50",
  vline_linetype = "dotted",
  vline_labels = FALSE,
  vline_label_position = c("auto", "top", "bottom"),
  vline_label_size = 3,
  vline_label_colour = NULL,
  vline_label_fill = NULL,
  vline_label_inset = 0.05,
  vline_label_digits = 0,
  ...
)

er_style_quantile_pointrange(
  data,
  config,
  stratify,
  exposure,
  response,
  strata,
  theme,
  label_size = 3,
  pointrange_size = NULL,
  pointrange_linewidth = NULL,
  ...
)

er_style_quantile_pointrange_vlines(
  data,
  config,
  stratify,
  exposure,
  response,
  strata,
  theme,
  label_size = 3,
  pointrange_size = NULL,
  pointrange_linewidth = NULL,
  vline_colour = "grey50",
  vline_linetype = "dotted",
  vline_labels = FALSE,
  vline_label_position = c("auto", "top", "bottom"),
  vline_label_size = 3,
  vline_label_colour = NULL,
  vline_label_fill = NULL,
  vline_label_inset = 0.05,
  vline_label_digits = 0,
  ...
)
Arguments
- data
The original data frame.
- config
Configuration for the specific plot.
- stratify
Logical: whether to stratify.
- exposure
Exposure variable.
- response
Response variable.
- strata
Stratification variable.
- theme
Theme components.
- point_size
Point size for
er_style_quantile_errorbar(). Defaults to2.- errorbar_width
Width of
er_style_quantile_errorbar()'s error bars. Defaults to0.025.- label_size
Text size for the per-bin value label. Defaults to
3.- ...
Additional named arguments forwarded from
er_plot_add_quantiles()'s own....- vline_colour, vline_linetype
Colour and linetype of quantile-bin boundary lines. Default to
"grey50"and"dotted"respectively.- vline_labels
Logical: whether the
_vlinesbuilders also label each bin boundary with its exposure value. Defaults toFALSE.- vline_label_position
One of
"auto"(the default),"top", or"bottom"– vertical placement ofvline_labels.- vline_label_size, vline_label_colour, vline_label_fill
Size, text colour, and background fill for
vline_labels.vline_label_sizedefaults to3;vline_label_colour/vline_label_filldefault toNULL(ggplot2::geom_label()'s own defaults).- vline_label_inset
Fraction of the response range
vline_labelsare inset from the panel edge. Defaults to0.05.- vline_label_digits
Number of decimal places
vline_labelsare rounded to. Defaults to0.- pointrange_size, pointrange_linewidth
Size and linewidth for
ggplot2::geom_pointrange(). Default toNULL, which leavesgeom_pointrange()'s own built-in size/linewidth defaults in effect.
Value
A geom, or a list of geoms; see er_style().
Details
See er_style() for the shared builder interface these functions
implement, including how to write a custom builder of your own.
Choosing a builder
All four builders summarise the same per-bin point/interval; which one to reach for is a choice of visual idiom, independent of response type:
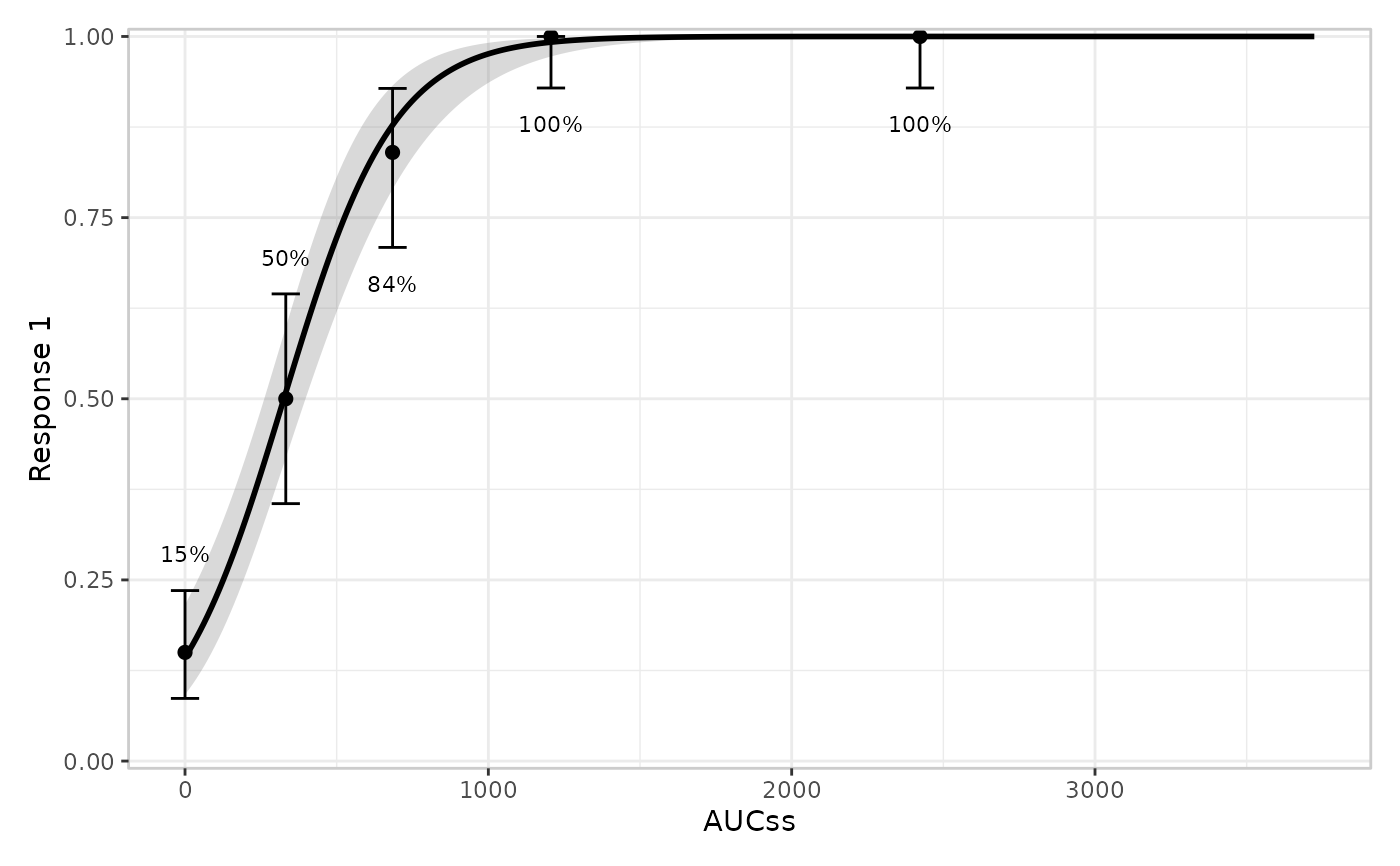
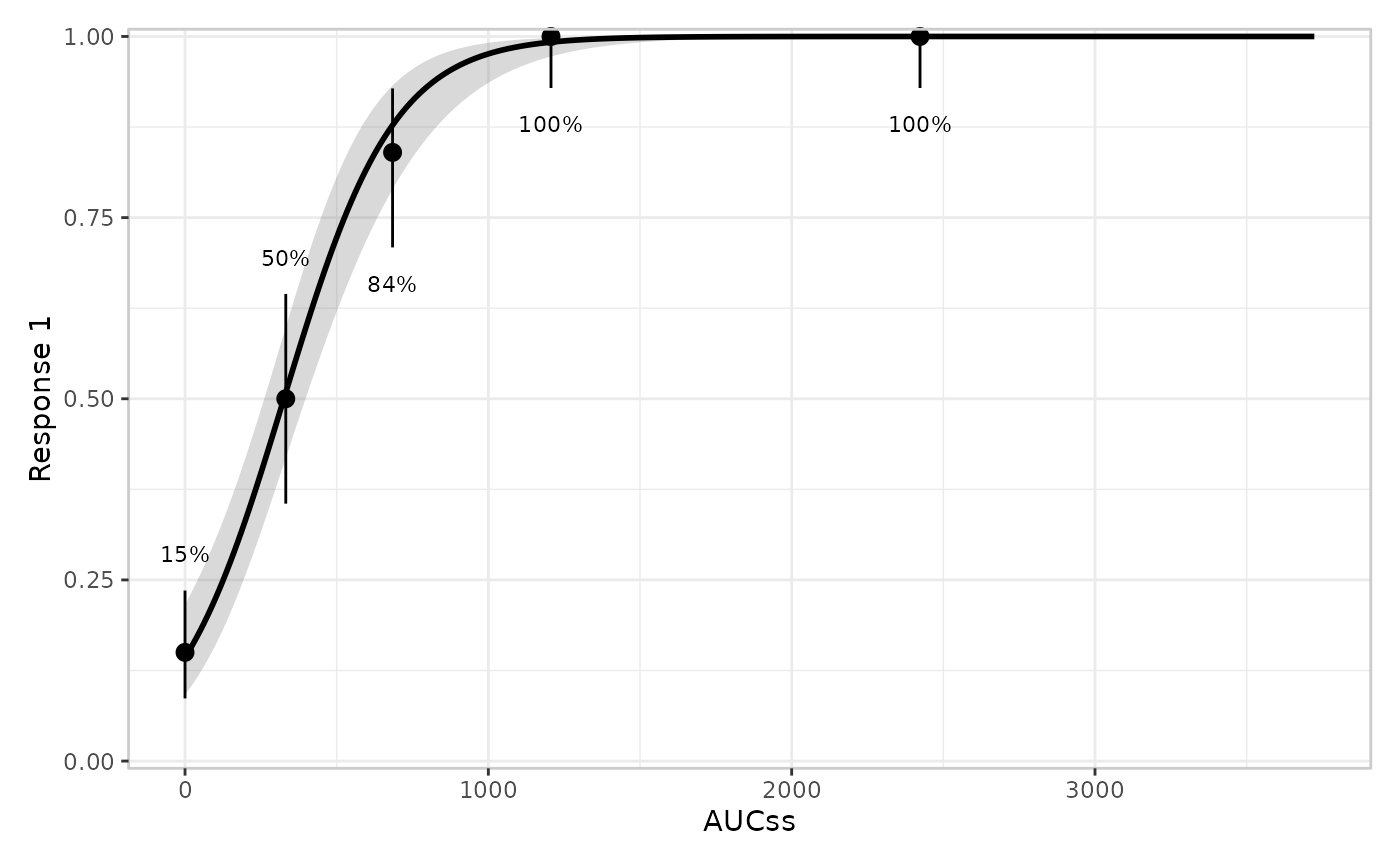
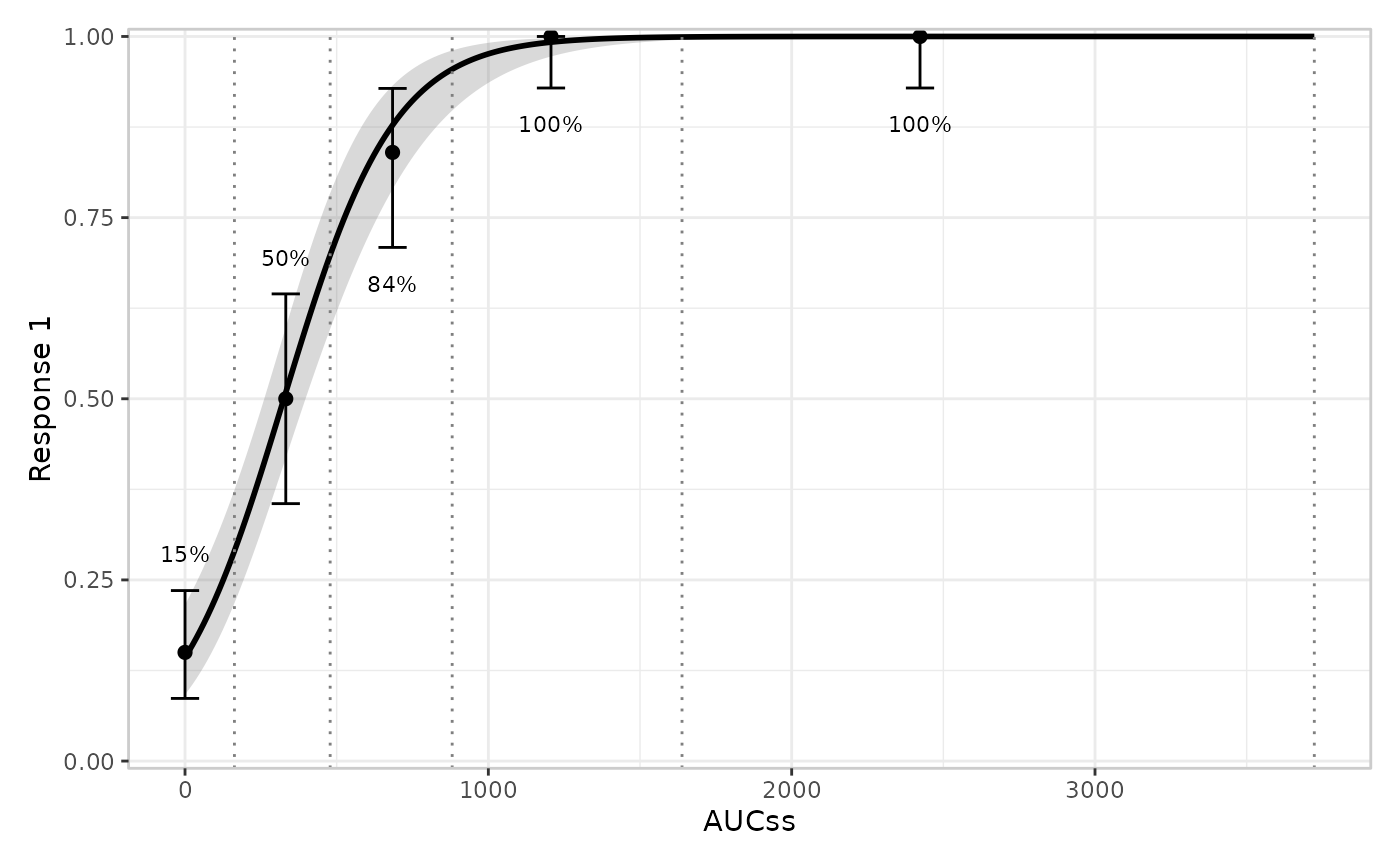
er_style_quantile_errorbar()(the default) – a point with an error bar.er_style_quantile_pointrange()– a point with a range line (ggplot2::geom_pointrange()) instead of an error bar.er_style_quantile_errorbar_vlines()/er_style_quantile_pointrange_vlines()– the same two idioms, plus a dotted vertical line at every quantile-bin boundary (see "Boundary lines" below).
All built-in quantile builders are tagged er_style_tag(fn, layer = "plot_quantile"), so er_plot_add_quantiles() errors informatively
if handed a builder tagged for a different layer.
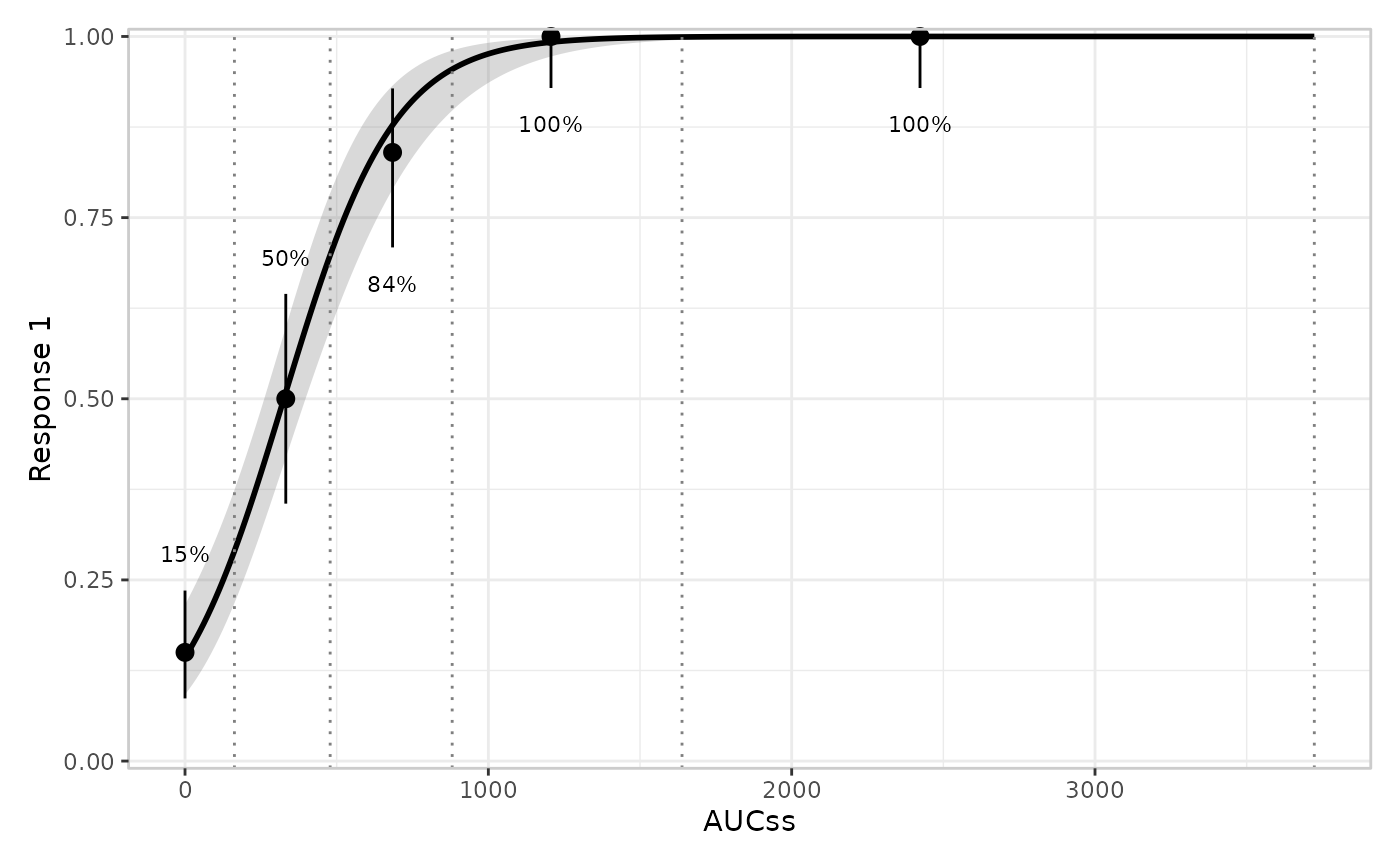
Boundary lines
The _vlines variants add a line at every quantile-bin boundary –
including the two outer boundaries at the minimum non-placebo
exposure and the overall maximum exposure, not just the boundaries
shared between two adjacent bins – so a reader can see every bin
edge from the plot alone. A boundary whose exposure value falls
outside a narrowed er_plot_theme() xlim is dropped (with a
warning), the same way a quantile summary marker is.
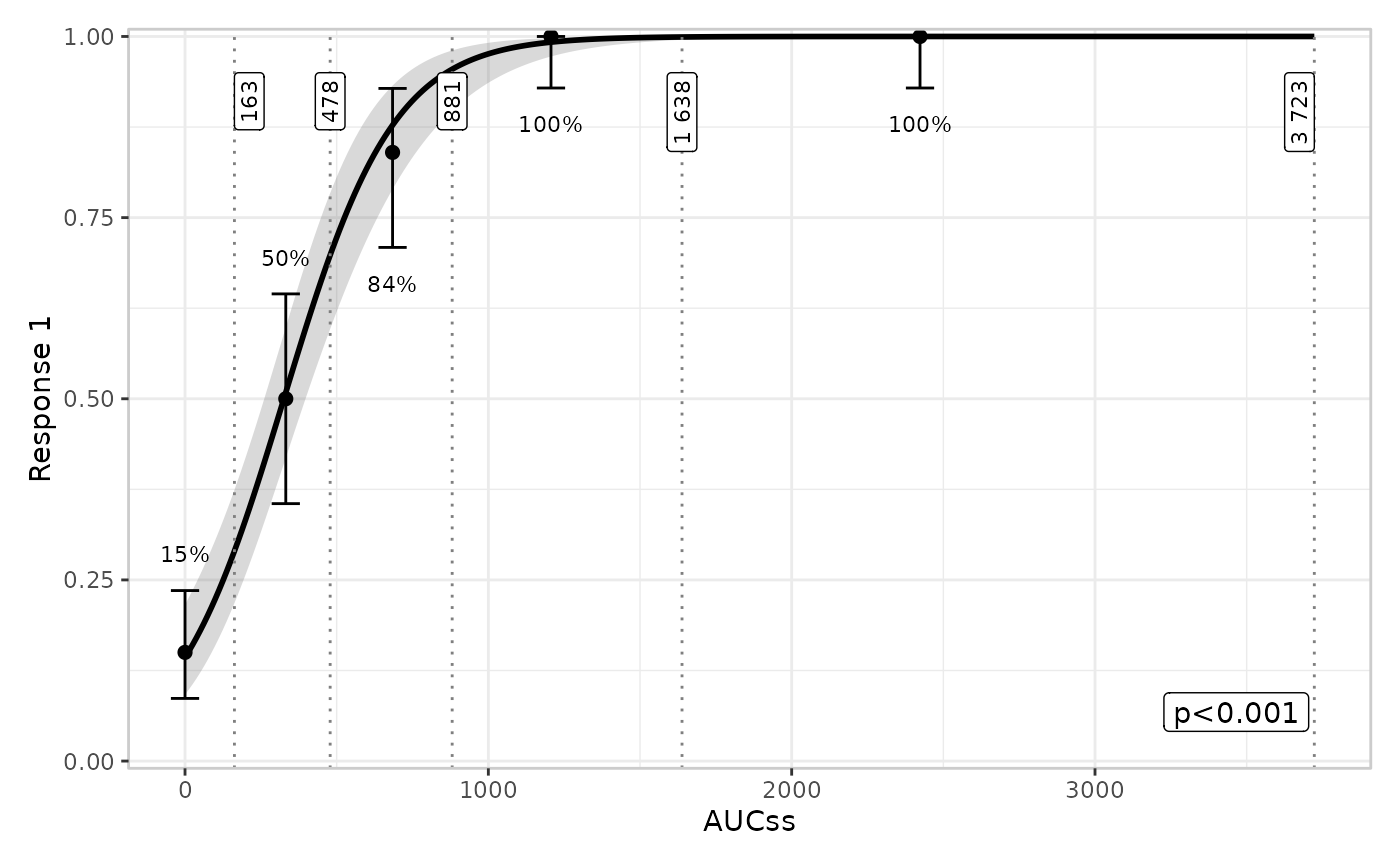
Boundary labels
The _vlines variants can also label each boundary with its
exposure value (vline_labels = TRUE, off by default). Labels are
drawn with ggplot2::geom_label() (an opaque background, since a
label sits directly on a vline spanning the full panel height) along
either the top or bottom edge of the panel. vline_label_position = "auto" (the default) picks whichever vertical half doesn't contain
the corner a summary annotation (er_plot_add_summary()) would place
itself in – based on the same raw-data corner-crowdedness
calculation the summary layer itself uses – so the two don't
collide; this works whether or not a summary layer is actually
present, since both layers compute the same deterministic quantity
independently. Override with "top"/"bottom" to place labels
manually instead.
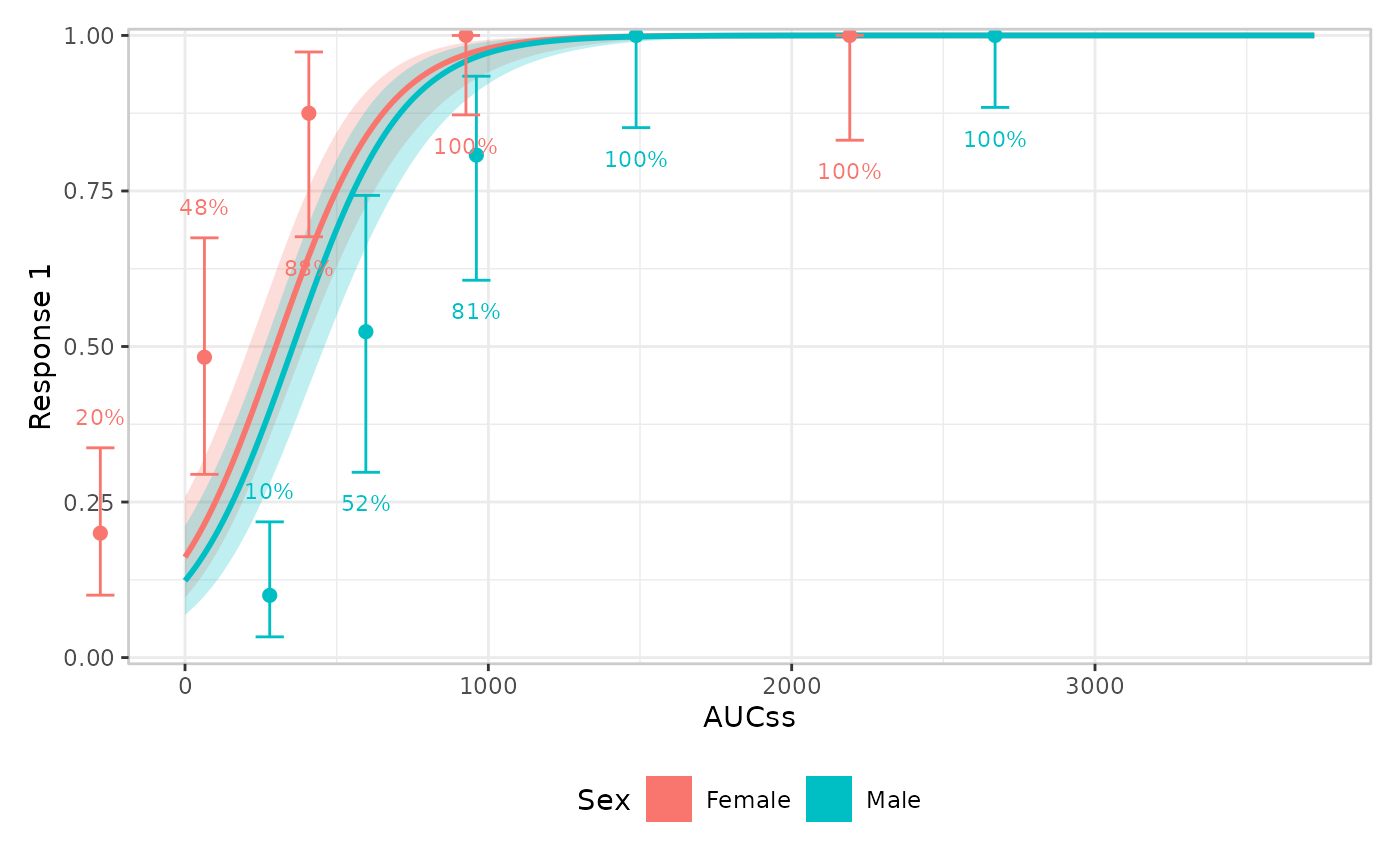
Stratified dodging
When stratified, all four builders horizontally dodge each quantile
bin's points/bars/labels apart by er_plot_theme()'s dodge_width
(a fraction of the exposure range, default 0.05) – a cross-layer,
stratification-wide setting controlled via er_plot_theme() rather
than a per-builder argument here, since it's about how stratification
lays out a dodged layer, not one builder's own visual style.
Examples
if (requireNamespace("erglm", quietly = TRUE)) {
  library(erglm)
  mod <- erglm_model(ae1 ~ aucss, erglm_data, family = binomial())

  # er_style_quantile_errorbar(): point + error bar, the default
  erglm_data |>
    er_plot(aucss, ae1) |>
    er_plot_add_model(mod) |>
    er_plot_add_quantiles(style = er_style_quantile_errorbar) |>
    plot()

  # er_style_quantile_pointrange(): a pointrange instead
  erglm_data |>
    er_plot(aucss, ae1) |>
    er_plot_add_model(mod) |>
    er_plot_add_quantiles(style = er_style_quantile_pointrange) |>
    plot()

  # er_style_quantile_errorbar_vlines(): the default, plus dotted
  # lines marking every quantile-bin boundary, including the outer
  # edges at the minimum non-placebo and maximum exposure
  erglm_data |>
    er_plot(aucss, ae1) |>
    er_plot_add_model(mod) |>
    er_plot_add_quantiles(style = er_style_quantile_errorbar_vlines) |>
    plot()

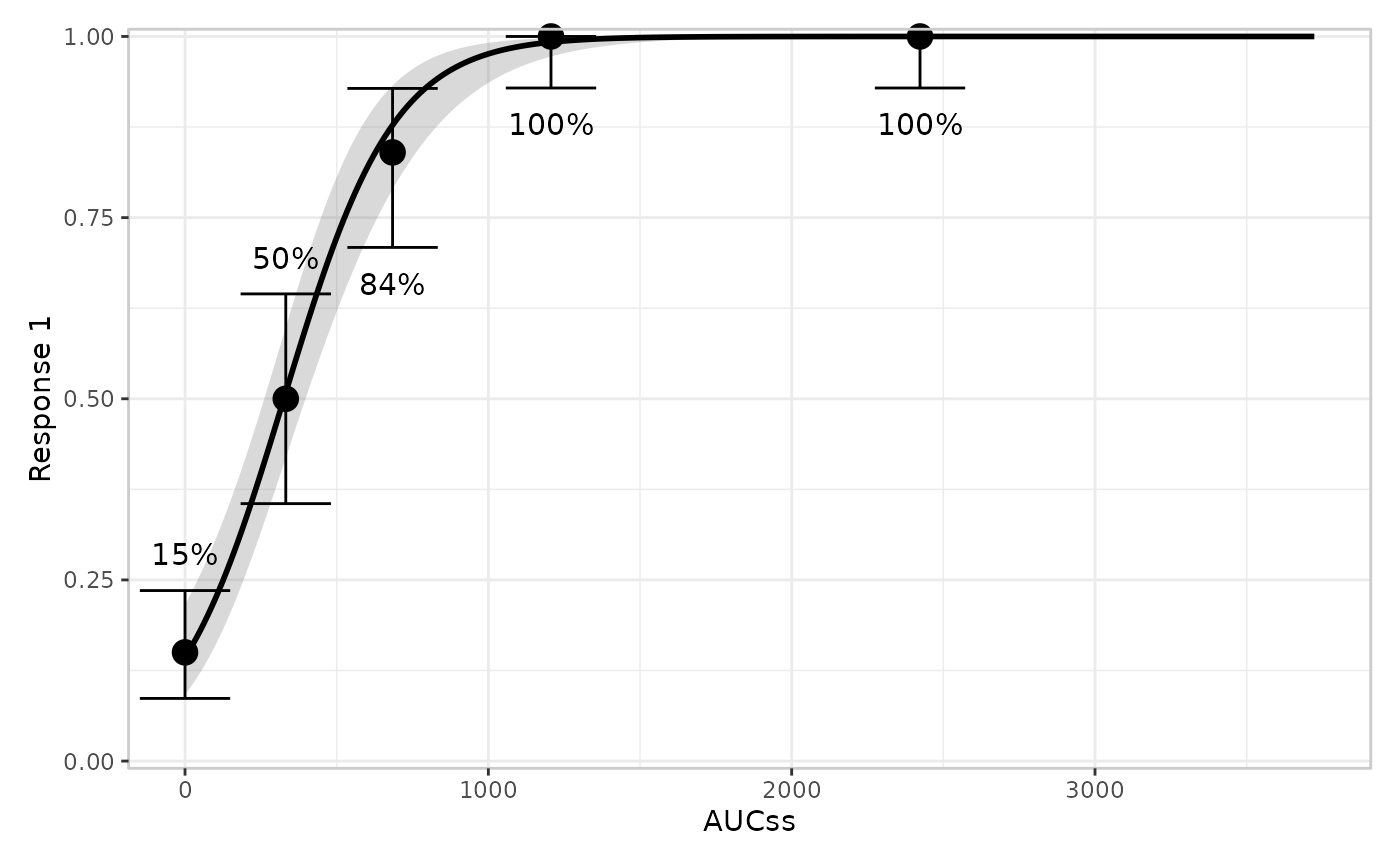
  # Customize the quantile builder's appearance.
  erglm_data |>
    er_plot(aucss, ae1) |>
    er_plot_add_model(mod) |>
    er_plot_add_quantiles(
      style = er_style_quantile_errorbar,
      point_size = 4,
      errorbar_width = 0.08,
      label_size = 4
    ) |>
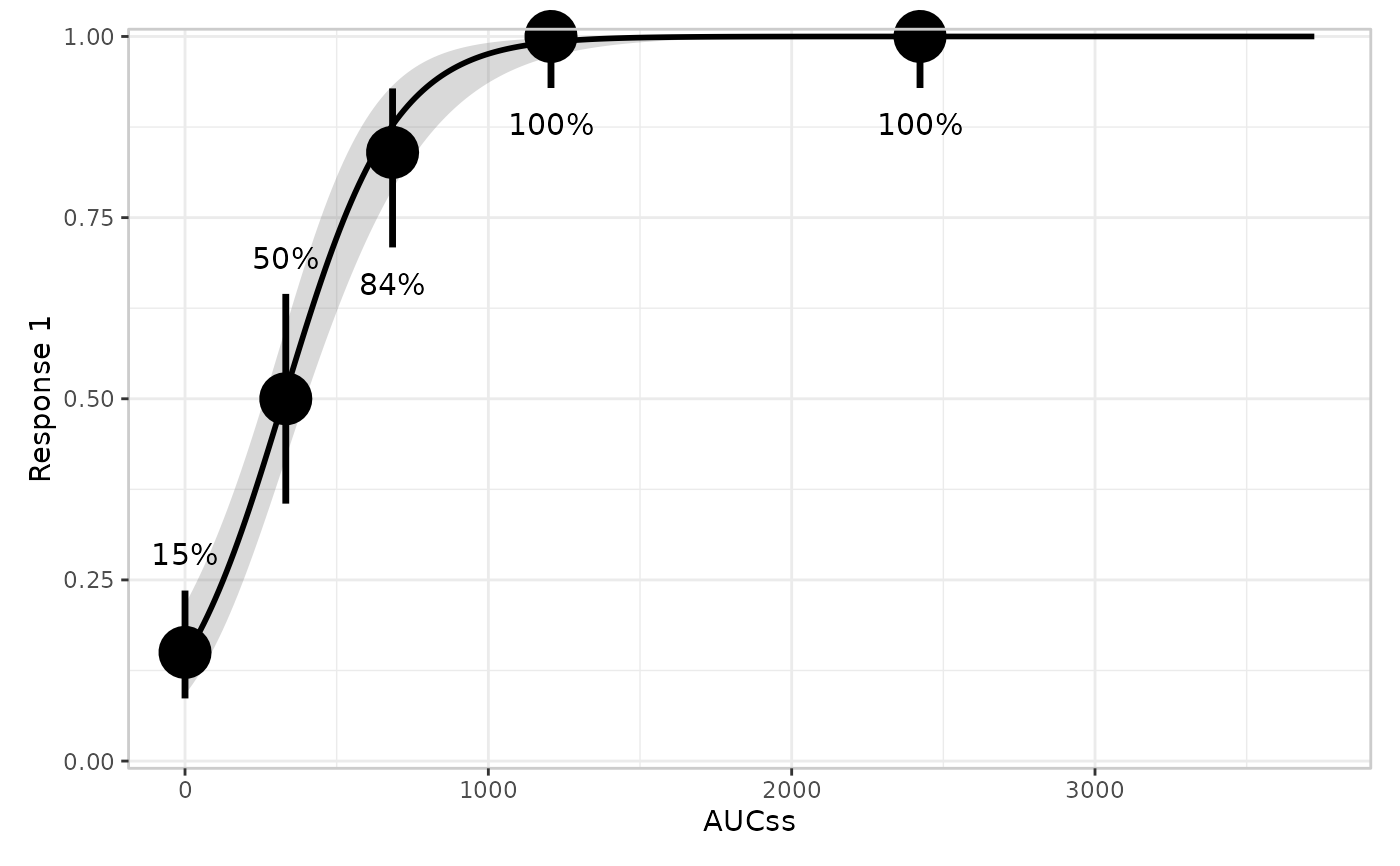
    plot()

  erglm_data |>
    er_plot(aucss, ae1) |>
    er_plot_add_model(mod) |>
    er_plot_add_quantiles(
      style = er_style_quantile_pointrange,
      label_size = 4,
      pointrange_size = 2,
      pointrange_linewidth = 1.2
    ) |>
    plot()

  # widening the stratum-dodge spacing via er_plot_theme()
  mod2 <- erglm_model(ae1 ~ aucss + sex, erglm_data, family = binomial())
  erglm_data |>
    er_plot(aucss, ae1, stratify_by = sex) |>
    er_plot_add_model(mod2) |>
    er_plot_add_quantiles(style = er_style_quantile_errorbar) |>
    er_plot_theme(dodge_width = 0.15) |>
    plot()

  # labeling every quantile-bin boundary (including the outer edges)
  # with its exposure value, placed automatically to avoid the
  # summary annotation
  erglm_data |>
    er_plot(aucss, ae1) |>
    er_plot_add_model(mod) |>
    er_plot_add_summary(mod) |>
    er_plot_add_quantiles(style = er_style_quantile_errorbar_vlines, vline_labels = TRUE) |>
    plot()

  # er_style_quantile_pointrange_vlines(): the pointrange equivalent of
  # er_style_quantile_errorbar_vlines()
  erglm_data |>
    er_plot(aucss, ae1) |>
    er_plot_add_model(mod) |>
    er_plot_add_quantiles(style = er_style_quantile_pointrange_vlines) |>
    plot()
}